Product Design, Manufacturing & Innovation Resources
Home » Online Tools » PolySolve Polynomial Regression Tool

PolySolve Polynomial Regression Tool

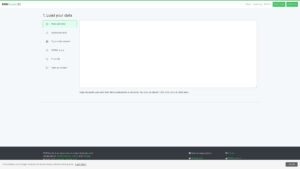
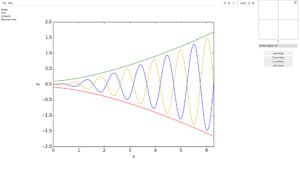
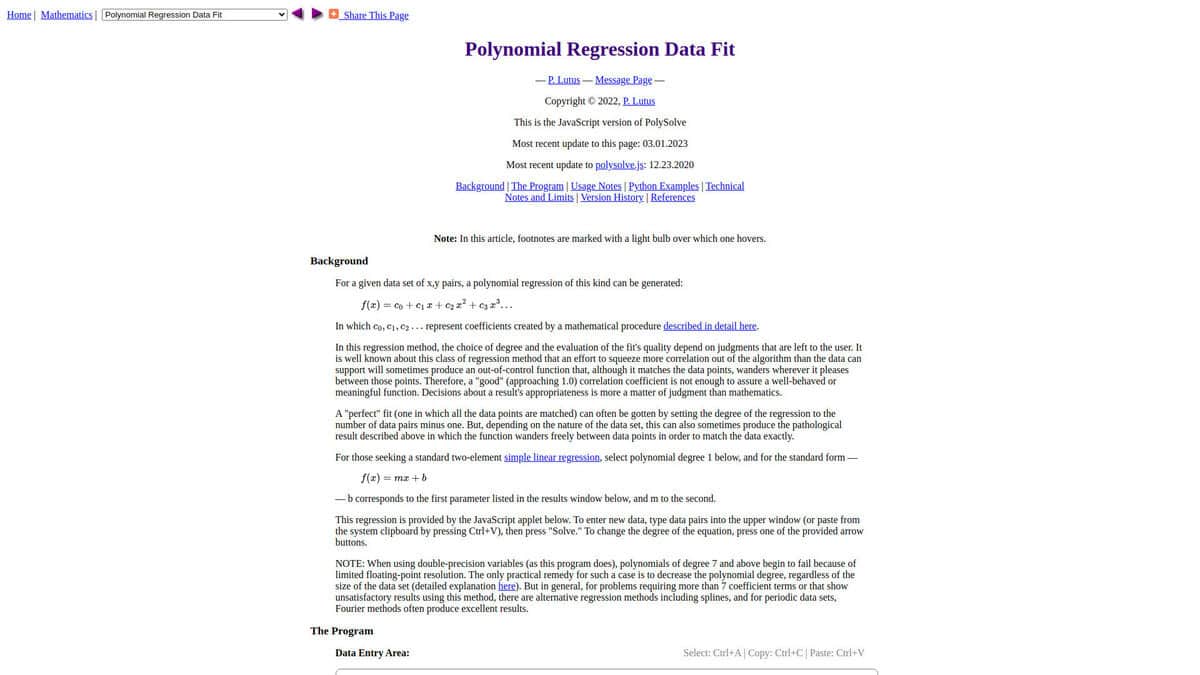
PolySolve is a polynomial regression tool by Paul Lutus that finds the least-squares polynomial of a chosen degree for a set of x and y data points. Data is pasted into a text area, the degree is selected, and the coefficients are calculated together with a plot of the fit.

The output includes the coefficient list, the correlation coefficient and the standard error, and the polynomial can be given in several output forms, including source code, so the fitted function can be placed directly into firmware, spreadsheets or analysis scripts. The degree can be raised until the fit is adequate, while the displayed error shows when the model starts to overfit.

It is a good fit for sensor calibration, lookup table replacement and empirical curve approximation. At high degrees and with ill-conditioned data the numerical stability limits the usable degree, so results should always be checked against the measured points.

See our disclaimer below: we have not verified whether data is processed only in the page. Avoid confidential measurement data.


Disciplines: Embedded systems, Instrumentation, Sensor calibration, Numerical analysis, Engineering.
Free alternative to Excel trendline, MATLAB.
PolySolve Polynomial Regression Tool compared with Excel trendline and MATLAB
PolySolve Polynomial Regression ToolExcel trendlineMATLAB
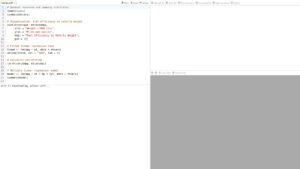
Fit method and result: Fits a polynomial of a chosen degree to pasted x,y pairs and returns the coefficients, a chart and a table generator that evaluates the fit over a range you specify.Fit method and result: A trendline is added to a chart and can be exponential, linear, logarithmic, polynomial, power or a moving average, so polynomial fitting is one option among several curve types.Fit method and result: polyfit returns the coefficients of a least-squares polynomial of degree n in descending powers, and an optional error structure can be passed to polyval to obtain error bounds.
Numerical limits: Floating-point resolution causes problems from about degree 7 upward, and the page says the degree often cannot exceed 7. A high correlation coefficient does not guarantee a well-behaved curve.Numerical limits: The Vandermonde matrix becomes badly conditioned at high order and a warning is issued. Centering and scaling x through the mu output improves stability, and high-order polynomials oscillate and extrapolate poorly.
Input and reuse of results: Data is typed or pasted into a data window, and results and data can be copied through the clipboard. A cookie auto-saves entered data up to 4096 bytes, and the page has no separate privacy policy.Input and reuse of results: The trendline belongs to a chart in a workbook, so the fit stays attached to the spreadsheet data it was drawn from.Input and reuse of results: Coefficients are stored as a vector in the workspace and evaluated with polyval, which allows scripted and repeated fits.
Openness: The JavaScript source is linked as polysolve.js and the Python examples on the page are released under the GPL. No licence is stated for the web application itself.

Privacy: we have no feedback of potential problem with this tool and author. But like many online services, you are here providing them with your own data. Depending of the criticity of your data, this is your responsibility to assess author's reputation and potential misusage, and to check and accept their terms and conditions, or not.

More Calculation, Data Analysis & Visualization tools

Suggest your best online tool:

Do you know a better, a complementary or a replacement website to the one listed above ?

> Suggest it here <

10th year anniversary

Full size images and downloads are only available, 100% free, for registered members.

> Login <