Product Design, Manufacturing & Innovation Resources
Home » Online Tools » Graphviz Online to Render DOT Graphs

Graphviz Online to Render DOT Graphs

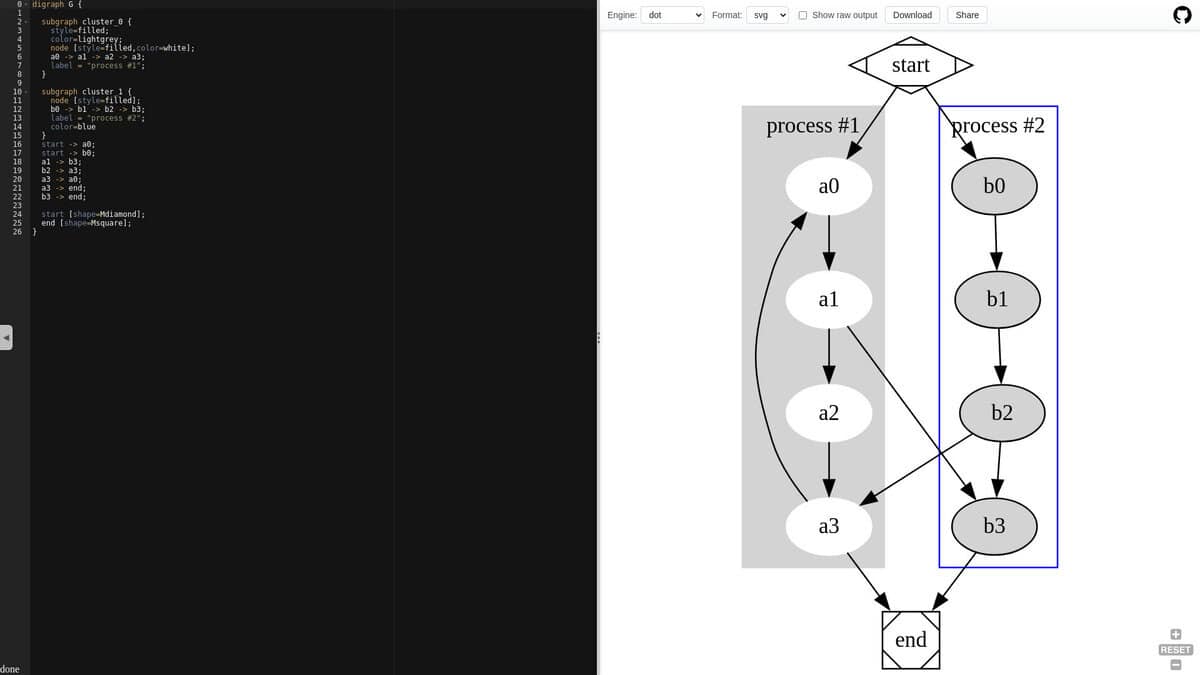
Graphviz Online renders DOT graph descriptions in the browser using a WebAssembly build of Graphviz. Text typed in the editor produces a diagram right away, covering directed and undirected graphs, trees, state machines, dependency graphs and call graphs.

The layout engine can be switched between hierarchical layout (dot), spring models (neato, fdp) and circular or radial layouts (circo, twopi), and the result can be downloaded as an image or as SVG. Node shapes, colors, clusters and edge styles are controlled with standard DOT attributes.

The DOT source is kept in the page URL, which makes diagrams easy to share and to keep under version control as plain text. It is a practical tool for architecture notes, process maps, dependency analysis and network diagrams where the layout should come from the data and not from manual drawing.


Disciplines: Software engineering, Network engineering, Systems engineering, Computer science, Bioinformatics, Technical writing.
Free alternative to yEd, Lucidchart.
Graphviz Online compared with yEd and Lucidchart
Graphviz OnlineyEdLucidchart
How the diagram is defined: The diagram is written as DOT text and laid out by a selectable Graphviz engine: dot for hierarchical layouts, neato and fdp for spring and force-directed placement, sfdp for larger graphs, circo for circular and twopi for radial layouts, plus osage and patchwork for clustered graphs.How the diagram is defined: Diagrams are drawn in a graphical editor, and layout algorithms arrange even large data sets at the press of a button. Excel (.xls) spreadsheets and XML data can be imported.How the diagram is defined: Diagrams are drawn interactively or generated with Lucid AI from text prompts. UML markup can produce sequence diagrams from text, and Google Sheets, Excel or CSV files can be linked to generate visualisations.
Output formats: The download and raw output options cover svg, png, json, xdot, plain and ps.Output formats: Exports bitmap and vector formats including PNG, JPG, SVG, PDF and SWF.
Platform and access: Runs as a web page, and its source is published in a GitHub repository. The page does not state a licence for the web application, while Graphviz itself is described as open source.Platform and access: Java Swing application for Windows, macOS and Unix or Linux that needs a suitable Java Runtime Environment.Platform and access: Offers real-time or asynchronous team collaboration and more than 100 integrations, including Jira, Confluence, Slack and Microsoft Teams.
Licence and cost model: Free, including for commercial use, under the yEd Software License Agreement. The licence does not permit distributing yEd yourself or using it in automated processes.Licence and cost model: A free sign-up option exists, with paid plans listed on a separate pricing page.

Privacy: we have no feedback of potential problem with this tool and author. But like many online services, you are here providing them with your own data. Depending of the criticity of your data, this is your responsibility to assess author's reputation and potential misusage, and to check and accept their terms and conditions, or not.

More 2D Graphics, Data Analysis & Visualization tools

Suggest your best online tool:

Do you know a better, a complementary or a replacement website to the one listed above ?

> Suggest it here <

10th year anniversary

Full size images and downloads are only available, 100% free, for registered members.

> Login <