MyCurveFit compared with OriginPro, GraphPad Prism, CurveExpert and MATLAB Curve Fitting Toolbox| MyCurveFit | OriginPro | GraphPad Prism | CurveExpert | MATLAB Curve Fitting Toolbox |
|---|
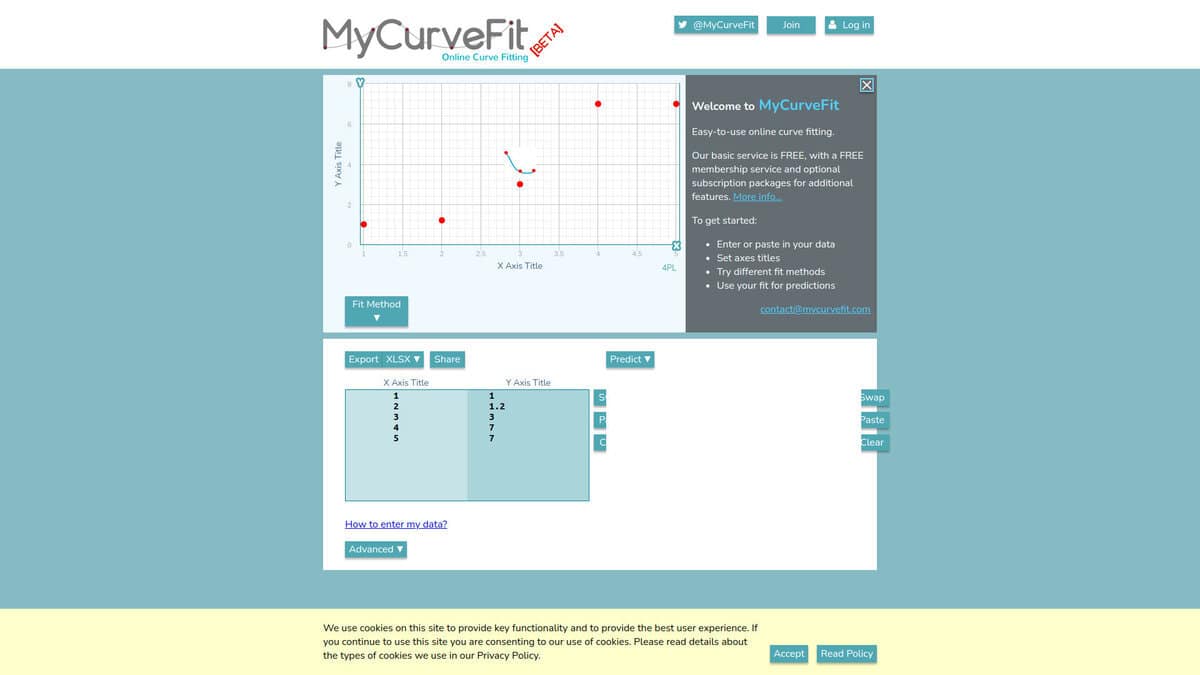
| Model scope: Fits data with several fit methods or with a user-defined equation, and the result can be used to make predictions. Models are entered on the web page and not scripted. | Model scope: Covers linear and nonlinear fitting, and the Pro level adds fitting with X and Y errors, orthogonal distance regression, global fitting of several curves and ranking of all functions in a category. | Model scope: Ships with over 100 prebuilt nonlinear models, allows custom models, and lets parameters be constrained. | Model scope: Offers over 60 built-in nonlinear models with automatic initial guesses, can rank the models against the data, and accepts custom models written as Python functions. | Model scope: Provides a library of linear and nonlinear models such as polynomial, exponential, Gaussian, power, rational and Weibull, custom equations, and spline and smoothing methods for curves and surfaces. |
| Statistical output: Fitting Comparison compares two models on one dataset or two datasets on one model, which supports model selection beyond a visual check. | Statistical output: Identifies outliers and assesses statistical significance, and gives step-by-step guidance on analysis choices and assumptions. | Statistical output: Produces HTML reports with parameter uncertainties, covariance matrices, residual plots, F-tests and Akaike information criterion, offers six weighting schemes, and was validated against the NIST Statistical Reference Datasets. | Statistical output: Confidence intervals can be estimated in post-processing, and the documentation also covers confidence and prediction intervals. |
| Platform and delivery: Runs in the browser and needs JavaScript. Results can be exported to Excel, PDF, Word and PowerPoint, and shared online. | | Platform and delivery: Commercial desktop software for Windows and Mac, with a free trial and a cloud feature for sharing projects. | Platform and delivery: Desktop application for Windows, Mac and Linux, and saved files can move between the systems. | Platform and delivery: Requires MATLAB. The Curve Fitter app works interactively and can generate MATLAB code, and a free trial is offered with pricing through sales. |
| Intended use: Quick fitting of a data table and sharing of the result, without installing software. | | Intended use: Aimed at researchers and scientists, with use cases such as dose-response modelling, pharmacokinetics, population growth or decay, enzyme inhibition and saturation binding. | Intended use: General curve fitting and data analysis with publication-quality 2D and 3D graphs, including multivariate regression with no limit on independent variables. | Intended use: Fitting of curves and surfaces to data inside the MATLAB environment, so fits can be combined with other MATLAB code. |