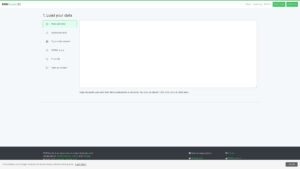
RAWGraphs Data Visualization
RAWGraphs is an open source tool that turns tabular data into vector charts. You paste or upload a spreadsheet, map
RAWGraphs is an open source tool that turns tabular data into vector charts. You paste or upload a spreadsheet, map
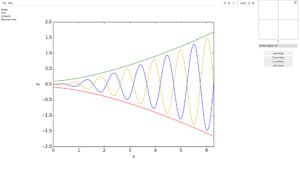
WebPlotDigitizer extracts numerical data from images of plots. You load a chart image, calibrate the axes by clicking known points,
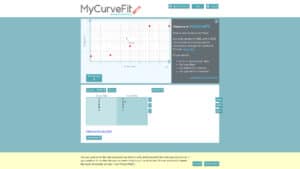
MyCurveFit fits mathematical models to measurement data directly in the browser. Data pairs are pasted or typed into a table,
PolySolve is a polynomial regression tool by Paul Lutus that finds the least-squares polynomial of a chosen degree for a
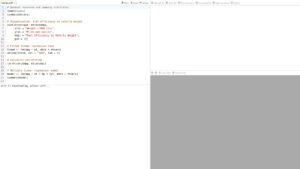
webR is a build of the R language compiled to WebAssembly, developed by Posit. The REPL page runs a full

JupyterLite is a distribution of JupyterLab that runs entirely in the web browser. Python code executes through WebAssembly, so no

From the National Institute of Standards and Technology (NIST) & SEMATECH, a full free statistic handbook for the industry and

An original map/cartography/visualisation tool: define up to 3 string patterns, and this tool will color the map depending on the

One of the must-have tool to represent any dataset in a graphical or interactive manner. This superb classified gallery of

Ever want to see a CSV ? Ever had some quote problem (missing quote or double-quote) and your CSV is