RAWGraphs Data Visualization
RAWGraphs is an open source tool that turns tabular data into vector charts. You paste or upload a spreadsheet, map
RAWGraphs is an open source tool that turns tabular data into vector charts. You paste or upload a spreadsheet, map
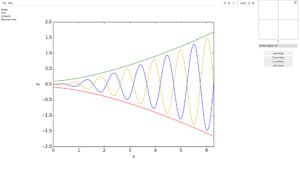
WebPlotDigitizer extracts numerical data from images of plots. You load a chart image, calibrate the axes by clicking known points,
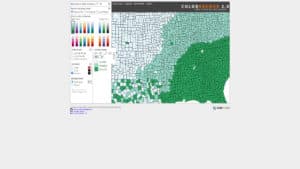
ColorBrewer is a reference tool for choosing color schemes for maps and charts, created by cartographer Cynthia Brewer at Pennsylvania

CoBLIS (for Color BLIndness Simulator.) transforms an uploaded image to show how it appears to people with red, green, blue
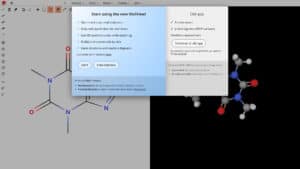
MolView combines a structural formula editor with a 3D model viewer in the browser. You draw a molecule, convert it
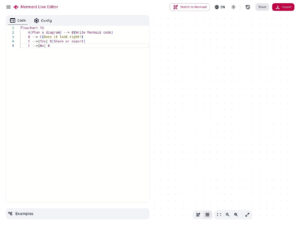
The Mermaid Live Editor renders complex diagrams and visualizations from Markdown-inspired text scripts and Mermaid format. It provides a real-time
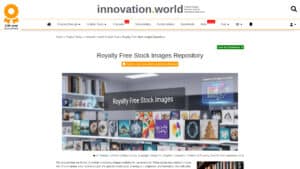
We share for free our own royalty free images repository – thousands of them – . Use for any of

Openverse is an open-source search engine that aggregates over 700 million Creative Commons-licensed and public domain media files, including images

A great list of free access images and multimedia repositories (check the licenses).In fact these are the sources used by

Europeana aggregates and provides access to over 50 million digitized items from more than 3,500 European cultural heritage institutions. The