ColorBrewer compared with Adobe Color, Coolors and Viridis palettes| ColorBrewer | Adobe Color | Coolors | Viridis palettes |
|---|
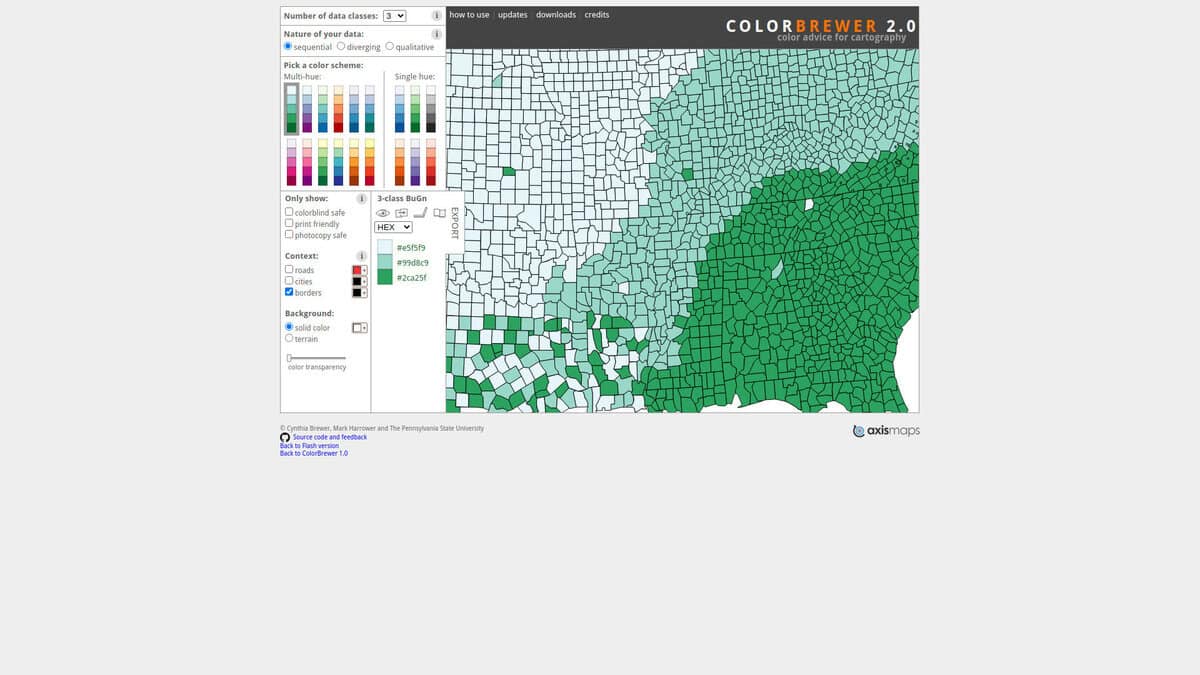
| Basis of the palettes: Provides ready-made schemes for sequential, diverging and qualitative data with 3 to 12 classes, so the scheme type follows the type of data on the map or chart. | Basis of the palettes: Builds themes from colour-harmony rules or from an image, so the starting point is a design choice and not the data type. | Basis of the palettes: Generates random 5-colour palettes and offers a library of user-created palettes, with an image picker to extract colours from a picture. | Basis of the palettes: A fixed set of colour maps for graphs that are perceptually uniform, including when converted to black and white for printing. |
| Colour vision and print checks: Schemes can be filtered for colorblind safe, print friendly and photocopy safe use, and a preview shows them on roads, cities, borders and terrain. | Colour vision and print checks: Accessibility tools flag conflicts between swatches for three types of colour blindness and show simulated views of a theme. | Colour vision and print checks: The accessibility tool is a contrast checker that evaluates colour pairs against WCAG. | Colour vision and print checks: Designed for readers with common forms of colour vision deficiency, so no extra filtering step is needed once the map is chosen. |
| Outputs and formats: Gives HEX, RGB and CMYK values, and exports a permalink, an ASE file, GIMP and Inkscape palettes, a JavaScript array or CSS classes. | Outputs and formats: Themes can be copied or downloaded as CSS, XML or LESS and saved to Creative Cloud Libraries for use in Photoshop and Illustrator. | Outputs and formats: Exports PNG, PDF, SVG, SCSS, CSS or ASE, and palettes can be shared by URL. Some formats are limited to the web app. | Outputs and formats: Delivered as an R package with ggplot2 bindings for discrete and continuous scales, plus a lighter package without the ggplot2 dependency. |
| Licence and cost model: The page shows a copyright notice for Brewer, Harrower and Pennsylvania State University and links the source code on GitHub, without stating a licence. | | Licence and cost model: Core features are free, the free tier caps saved palettes and projects, and a paid Pro tier lifts those limits. | Licence and cost model: Released under the MIT licence and distributed through CRAN. |