Vega Editor compared with Tableau, Observable and Power BI| Vega Editor | Tableau | Observable | Power BI |
|---|
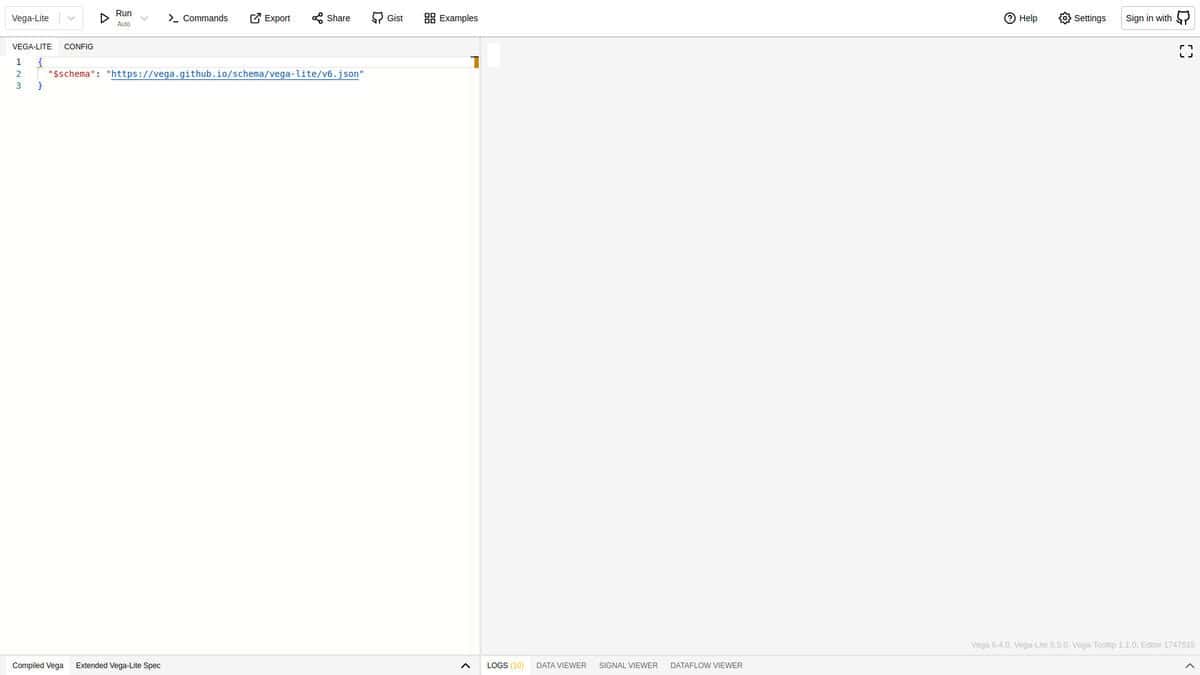
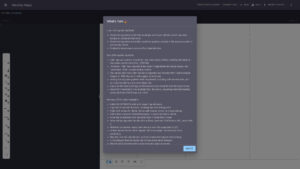
| Approach and interface: The Vega Editor is a web application for authoring and testing Vega and Vega-Lite visualizations, with example specifications that show encodings and interaction techniques. Charts are written as JSON text, not built by dragging fields. | Approach and interface: Tableau Desktop connects to files and databases and builds views from the data connection. Its connector list depends on the version of Desktop purchased. | Approach and interface: Observable Plot is a JavaScript library for exploratory data visualization. It can be used in Observable notebooks by returning a plot from a cell, in plain HTML, in npm-based apps or in Node.js. | Approach and interface: Power BI Desktop is a Windows application for connecting to data, transforming it with Power Query Editor and building interactive reports from fields and visuals. |
| Openness and licence: The editor repository is under the BSD-3-Clause licence. Vega and Vega-Lite are open source, led by the University of Washington Interactive Data Lab. | | Openness and licence: Plot is released under the ISC licence and depends on D3. It generates SVG. | Openness and licence: Power BI Desktop is a free download. Free standalone users cannot collaborate with colleagues in the Power BI app, but they can share visuals as PDF or PowerPoint files. |
| Data sources: Data is loaded into a specification from a URL or inline. Vega-Lite offers aggregation, binning, filtering and sorting transformations in the specification itself. | Data sources: Tableau connects to spreadsheets, text files, relational and cube databases, cloud sources and published data sources. It also offers JDBC, ODBC, Web Data Connector and connector SDK options with limited support. | | Data sources: Power BI Desktop imports from Excel, databases and web sources, and Power Query Editor supports column removal, row filtering and data type changes. |
| Reproducibility and sharing: A specification is plain text that can be kept in version control. Users can sign in with GitHub to access their gists. Vega-Lite compiles to Vega for advanced cases, and Python bindings such as Altair exist. | | Reproducibility and sharing: Plot output is a detached SVG or HTML element that the developer inserts in the page, or serializes in Node.js. | Reproducibility and sharing: Reports are saved locally, then published to the Power BI service to share, embed in dashboards and schedule data refreshes. |
| Platform: The editor runs in the browser and needs JavaScript enabled. | | Platform: Plot runs wherever JavaScript runs, including browsers and Node.js with JSDOM. | Platform: Power BI Desktop is Windows only, installed from the Microsoft Store or the Microsoft Download Center. |