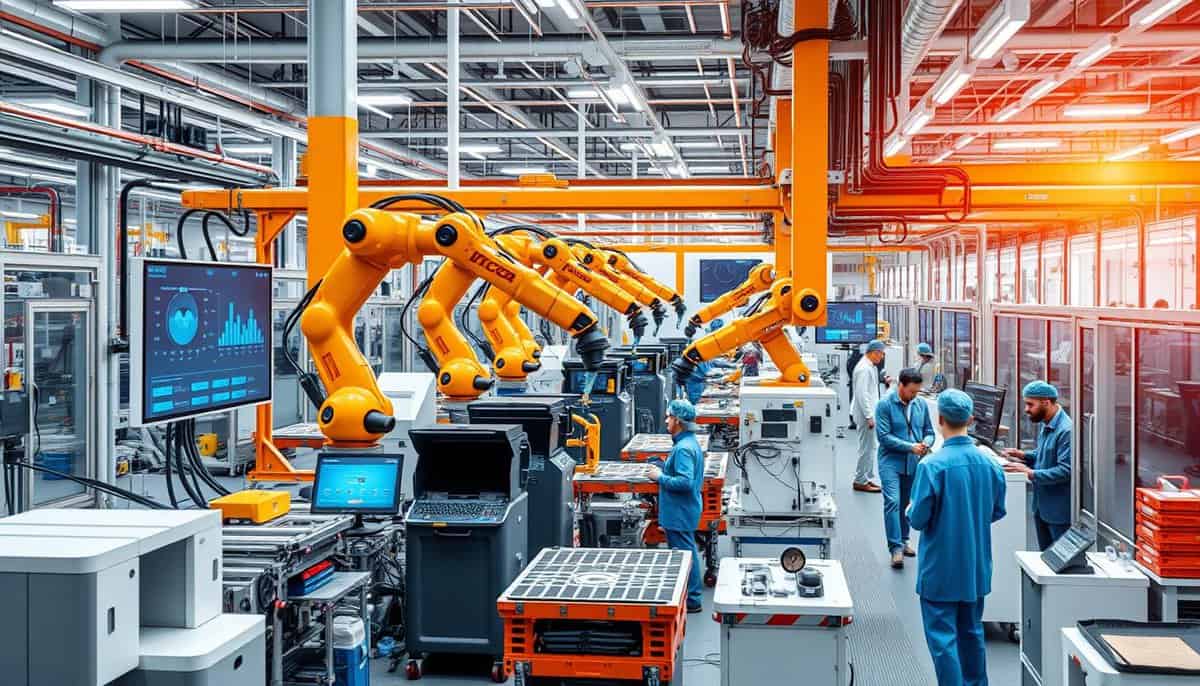
Are you making the most of every tool at your disposal to enhance production? Knowing and using the right Key Performance Indicators (KPIs) can change your operation’s success. These metrics help reduce downtime and plan production better, showing every part of the manufacturing process.
今日の製造業において、生産に関するKPIは不可欠です。KPIは企業が生産工程を監視、分析、改善するのに役立ちます。総合設備効率(OEE)、在庫回転率、納期遵守率といった指標を用いることで、企業は問題点を特定し、無駄を削減し、将来のニーズを予測することができます。これらの指標は、市場の変化や環境の変化に適応しながら、生産を目標達成へと導きます。これにより、業務の俊敏性と効率性が向上します。
主なポイント
- KPIを適切に活用することで、製造業の効率を大幅に向上させることができる。
- 総合設備効率(OEE)は、稼働率、性能、品質を総合的に評価する指標です。
- 在庫回転率が低いと、資金が解放され、顧客ニーズにより的確に対応できるようになる。
- 時間通りの配達は、顧客満足度を高め、従業員のモチベーションを向上させる上で非常に重要です。
- 顧客返品の追跡は、生産上の問題を解決するために非常に重要です。
生産KPIとは何ですか?
生産における主要業績評価指標(KPI)は、製造業における重要な指標です。これらは、生産プロセスがどれだけうまく、効率的に機能しているかを追跡します。これらの指標は、企業が何がうまくいっていて、何がうまくいっていないかを把握するのに役立ちます。これにより、企業は業務を改善し、より円滑な運営を実現できます。
生産KPIの定義
生産KPIとは、生産プロセスが目標をどの程度達成しているかを示す数値です。サイクルタイム、スループット率、総合設備効率(OEE)といった重要な要素が含まれます。これらの指標を追跡することで、企業は生産を微調整し、進捗状況を正確に測定することができます。
KPI追跡の重要性
KPIを追跡することの価値は非常に大きい。KPIは膨大なデータを有用な洞察へと変換する。定期的なモニタリングが重要な理由はいくつかある。
- 目標設定と目標達成: KPI(重要業績評価指標)を用いることで、明確な目標設定が可能になります。これにより、生産ラインを企業の目標に沿って維持することができます。
- ボトルネックの特定: KPI(重要業績評価指標)を分析することで、企業は生産における遅延を迅速に発見できます。これにより、問題を速やかに解決し、円滑な業務運営を維持することが可能になります。
- 生産工程の効率向上: KPI(重要業績評価指標)に注力することで、企業は効率性を向上させることができます。つまり、コスト削減と製品生産量の増加につながるのです。
KPI(重要業績評価指標)を常に監視することで、製造業者は業績を向上させることができます。これは、変化の激しい市場で優位性を維持するために不可欠です。
生産KPIの種類
生産KPIには主に3つの種類があります。これらは機械、製品、そしてコスト効率に焦点を当てています。これらのKPIカテゴリを理解することで、生産プロセスの追跡と改善をより効果的に行うことができます。
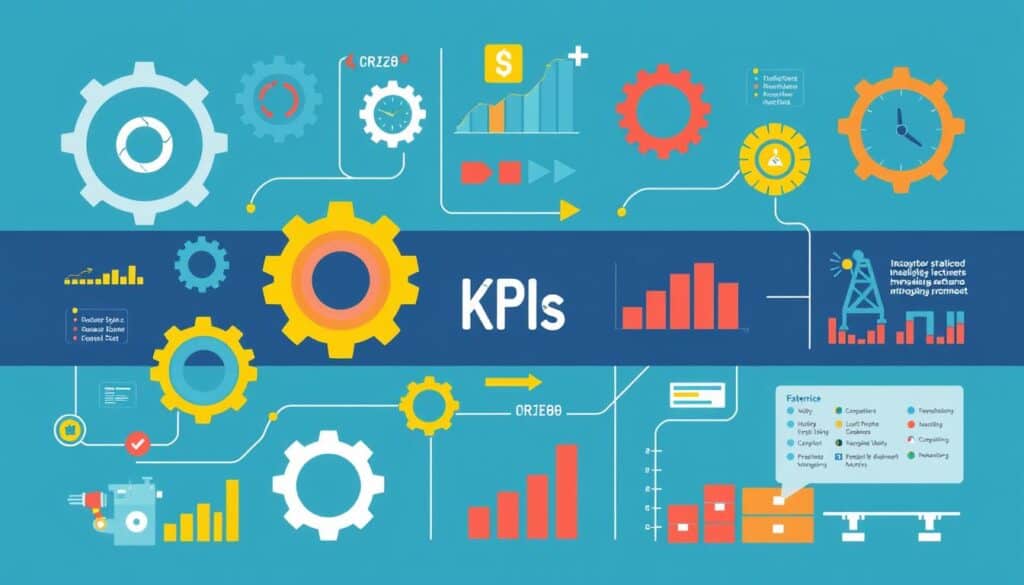
機械設備または資産に焦点を当てた製品
このKPIタイプは機械と 資産運用管理重要な指標は以下のとおりです。
- 機械稼働率: これは、機器が稼働し続ける時間を測定するものです。計算式は、(総稼働時間/利用可能な生産時間)×100です。目標は、機械の稼働率を90%に維持することです。
- 不良率: これは製造された製品の品質を追跡するものです。計算式は「不良品数 ÷ 生産個数 × 100」です。目標は不良率を下げることです。
- 総合設備効率(OEE): これは機械の稼働状況をチェックするものです。計算式は(生産量 × 最大サイクルタイム)÷ 利用可能生産時間です。今年はOEEを5%向上させたいと考えています。
ユニットまたは製品に焦点を当てた
ここでは、KPIはユニット数または製品数に着目し、生産状況を把握するための情報を提供します。含まれる指標は以下のとおりです。
- サイクルタイムこれは1回の生産サイクルにかかる時間です。
- 生産能力率これは、可能な最大出力量を示しています。機械の処理能力×時間で計算されます。
- スループット率これは、時間の経過に伴う製品生産量を測定するものです。
コスト重視
コスト重視のKPIは、資金状況を把握し、生産コストを低く抑えるのに役立ちます。主な指標は以下のとおりです。
- 単位当たりの生産コストこれは、製品1個を製造するのにかかるコストを測定するものです。計算式は、総製造コスト÷生産個数です。目標は、2022年までに製品1個あたりの製造コストを2セント削減することです。
- ユニットメンテナンス費用これは、ユニットあたりの維持費を算出したものです。総維持費÷生産ユニット数で計算されます。今年の目標は、ユニット維持費を5%削減することです。
- 未使用容量コストこれは、生産能力をフル活用しない場合のコストへの影響を検証するものです。計算式は、利用可能な未使用生産能力の割合 × 総製造コストです。当社は、6ヶ月間で未使用生産能力を10%削減することを目指しています。
以下に、これらのカテゴリにおける主要な指標を示す表を示します。
| KPIの種類 | メトリック | 式 | 目標例 |
|---|---|---|---|
| 機械設備または資産に焦点を当てた製品 | 機械稼働率 | (機械使用時間合計/利用可能な生産時間)×100 | 各マシンの稼働率を90%に維持する |
| ユニットまたは製品に焦点を当てた | 生産能力率 | 機械処理能力率×時間 | 各機械の稼働率が90%であることを確認してください。 |
| コスト重視 | 単位当たりの生産コスト | 総製造コスト ÷ 生産数量 | 2022年までに単位生産コストを2セント削減する |
Key Performance Indicators (KPIs) for production
KPIs for production cover many metrics key for assessing manufacturing efficiency and productivity. These indicators provide data that helps manufacturing leaders make smart choices. They work to optimize operations, lower costs, and boost output. Knowing how to track manufacturing with key metrics is vital to compete today.

Several KPIs measure different aspects of production. They are crucial for quality assurance, equipment upkeep, cost control, and overall productivity. Key production KPIs include:
- Revenue: The total income from sales or services.
- Gross Profit Margin: The revenue percentage after removing the cost of goods sold.
- Return on Investment (ROI): The profit to investment ratio.
- Customer Acquisition: The new customers gained within a period.
- Customer Retention: The rate of customers staying over time.
- Employee Satisfaction: How happy employees are in the company.
- Website Traffic: The site visitors count over time.
- Conversion Rate: The share of visitors who perform a desired action.
- Inventory Turnover: How often inventory is sold and replaced.
- Time to Market: The period to launch a new product.
Manufacturing-specific KPIs include:
- Count: the total products made.
- Reject ratio: the scrap production measure.
- Capacity utilization: how much production capacity is used.
- Rate: the speed of producing goods.
- Target: specific goals for production periods.
- タクトタイム: time needed to complete a task.
- 総合設備効率(OEE): the production equipment’s efficiency.
- Downtime: the time when production equipment is idle.
- Cycle time: the total time for a full production cycle.
- Lead time: the time for a product to go through production.
To monitor manufacturing well, finding the most crucial KPIs is key. Setting targets for each KPI, and consistently watching and analyzing KPI data, helps track progress and spot improvement areas. By using these indicators, manufacturers can get better results and stay ahead in the market.
| メトリック | 意味 |
|---|---|
| OEE | Calculation: Availability x Performance x Quality |
| Total cycle time | Components: Production Time + Inspection Time + Transportation Time + Wait Time + Any Other Relevant Time |
| Throughput | Formula: Number of Units Produced ÷ Total Time of Production |
| ROI | Formula: (Total Investment / Net Profit) x 100 |
| On-time delivery | Formula: On-Time Units Delivered ÷ Total Units Delivered |
| Changeover time | Formula: Time to Produce First Quality Item – Time to Produce Last Quality Item |
| 収率 | Also known as FTT; Formula: (Total Items Produced – Defective Items) ÷ Items Produced |
| Scrap | Formula: Total Scrap ÷ Total Product Run |
| Customer return rate | Formula: Rejected Goods ÷ Total Number of Goods Delivered |
| Maintenance cost | Formula: (Maintenance Labor + Parts) ÷ Hours Running |
Top Production KPIs to Monitor
Monitoring production KPIs is key to manufacturing success. By focusing on important metrics, companies can see where they need to do better. They can improve how things work. Let’s look at four main production KPIs that manufacturers can’t do without.
サイクルタイム
Cycle time measures how long making a product takes, from beginning to end. This KPI shows how fast products are made. It spots slowdowns in making goods. Watching and cutting down cycle time boosts manufacturing speed and efficiency.
Throughput Rate
The throughput rate tells how many items are made in a set time. It shows if a production line is doing well. A high rate means things are running smoothly. Yet, it’s important to keep making high-quality products.

Production Attainment
Production attainment compares what was actually made to the goals. It’s vital for checking if manufacturing aims are reached. A high rate means good progress. A low rate might show problems that need to be fixed.
総合設備効率(OEE)
Overall Equipment Effectiveness (OEE) looks at three key parts: how available, performant, and quality the equipment is. The best factories score about 85% on OEE. Most companies score between 40% and 60%. Keeping an eye on OEE ensures machines work well and downtime is minimal. Forbes says downtime can cost companies $50 billion a year.
| KPI | 意味 | Importance |
|---|---|---|
| サイクルタイム | Time to complete one production cycle | Identifies bottlenecks and improves speed |
| スループット率 | Units produced over time | Assesses production capacity and efficiency |
| Production attainment | Actual output vs. planned targets | Tracks progress against goals |
| 総合設備効率(OEE) | Combines availability, performance, quality | Maximizes equipment efficiency and uptime |
How to Calculate Essential Production KPIs
Achieving manufacturing excellence means knowing your key performance indicators (KPIs) well. Using KPI calculation effectively and setting the right KPI targets help make smart choices and improve operations. Let’s explore important performance metrics formulas and look at examples.
Formulas for Calculating KPIs
It’s crucial to understand the formulas for production KPIs. This knowledge helps measure and track accurately. Here are some essential KPIs and their performance metrics formulas:
- サイクルタイム: cycle Time = Process End Time – Process Start Time
- Asset utilization: (Actual Output / Maximum Capacity) x 100
- Opportunity gap: Maximum Capacity – Actual Output
- 総合設備効率(OEE): Availability x Performance x Quality
- Capacity utilization: Actual Factory Utilization / Total Productive Capacity
- On-time delivery: Number of units ordered / Number of orders delivered on time
- スループット率: Production Time / Number of Units Produced
Examples of KPI Goals
After mastering KPI calculation, setting KPI targets in line with your goals is the next step. Here are examples of goals to aim for:
- Reduce cycle time: work to cut cycle time by 10% in the coming quarter.
- Improve asset utilization: boost asset use to 85% for better efficiency.
- Enhance on-time delivery: raise the on-time delivery rate to 95% to please customers.
- Optimize OEE: aim for an OEE score of 80% by tackling downtime and quality issues.
Below is a detailed table showing key KPIs, their formulas, and targets:
| KPI | 式 | Target Goal |
|---|---|---|
| サイクルタイム | Process End Time – Process Start Time | Reduce by 10% |
| Asset Utilization | (Actual Output/Maximum Capacity) x 100% | Increase to 85% |
| Opportunity Gap | Maximum Capacity – Actual Output | Minimize gap by 15% |
| 総合設備効率(OEE) | Availability x Performance x Quality | Achieve 80% |
| Capacity Utilization | Actual Factory Utilization/Total Productive Capacity | Maximize to 90% |
| On-time Delivery | Number of units ordered / Number of orders delivered on time | Reach 95% |
Common Challenges in Measuring Production KPIs
It’s important for organizations to measure production KPIs to improve efficiency. But, measuring KPIs has its challenges. One main challenge is ensuring the data is right.
Problems like mistakes, double entries, and old info can harm KPI efforts. Data silos make it worse by splitting up the data. This can cause wrong decisions.
For better decision-making, companies need strong data management. They should use new tech and focus on data. Choosing the best KPIs is also hard but crucial.
Organizations get overwhelmed by too many metrics, which can confuse their KPI strategy. KPIs should match the company’s goals. Teams must work together and understand their business well.
Setting realistic goals is another big hurdle. Unrealistic targets can make employees feel bad, leading to missed goals. It’s better to aim for small wins than impossible goals.
Tracking metrics like sales growth, customer happiness, and team efficiency is vital. These KPIs show where a business stands. They help spot strengths and areas to improve.
With the right data and analysis, companies can see why they’re doing well or not. KPIs can also aid in doing a SWOT analysis, giving a full picture of performance.
| Challenge | 詳細 |
|---|---|
| Data Quality Issues | Inaccuracies, inconsistencies, and incompleteness in data. |
| Data Silos | Fragmented data landscape within organizations. |
| Selecting Relevant KPIs | Difficulty in choosing specific, measurable, and contextually relevant metrics. |
| Achievable Targets | Risk of demotivation from unattainable goals. |
To beat these challenges, companies should train their teams well. Good training helps keep data correct and makes KPIs useful. Overcoming these issues is key to getting reliable insights and hitting production goals.
Best Practices for Implementing KPI Dashboards
Implementing effective KPI dashboards is key to boosting production and making data-driven decisions. They should be user-friendly and integrate real-time manufacturing data. This way, organizations can gain insights to improve their operations.
Designing Effective Dashboards
Designing a KPI dashboard requires understanding the users and their needs. It should focus on simplicity, ease of use, and clear information layout. These aspects ensure users can quickly understand data and make decisions.
High-level insights come from strategic dashboards, helpful for top management. Operational dashboards, on the other hand, provide real-time data for daily decision-making. Choosing the right software, like Klipfolio or Tableau, lets organizations customize dashboards to their needs.
Using Real-Time Data for Insights
Real-time data in KPI dashboards spot issues and opportunities instantly. Operational dashboards show live updates, helping to adjust quickly and improve constantly.
A KPI Institute study found 68% of companies with a KPI strategy saw business improvements. Analytical dashboards dive deep into data for root causes, while tactical dashboards track goal progress. This helps everyone in the organization aim for excellence.
Setting SMART KPI targets helps ensure goals are clear and achievable. For example, a サイバーセキュリティ firm might aim for 50,000 monthly visitors, tracking time on site and bounce rates as success metrics.
Well-designed KPI dashboards, aligned with goals, enhance data knowledge and a culture of improvement. This leads to better efficiency and business growth.
よくある質問
生産KPIとは何ですか?また、なぜ重要なのでしょうか?
生産における主要業績評価指標(KPI)は、製造プロセスの成功度を測定するものです。これらは、効率性を測定し、問題点を特定し、目標を達成するために不可欠です。これにより、事業全体のパフォーマンスが向上します。
どのような種類の生産KPIを監視すべきでしょうか?
生産KPIには3つの種類があります。機械稼働率などの機械設備・資産に焦点を当てたもの、スループット率などの製品・単位に焦点を当てたもの、そして単位生産コストなどのコストに焦点を当てたものです。これらの指標を常に監視することで、生産性の向上につながります。
重要な生産KPIはどのように計算しますか?
生産KPIの算出には、特定の計算式を使用します。サイクルタイムは、生産終了時間から生産開始時間を差し引いて算出します。これらの計算方法により、明確な目標を設定し、改善状況を追跡できます。
製造効率を監視する上で、最も重要な生産KPIは何ですか?
重要なKPIには、サイクルタイムとスループット率が含まれます。また、生産達成率と総合設備効率(OEE)も重要です。これらは、製造のスピード、効率、および生産量を示します。
生産および品質最適化に関する外部リンク
国際規格
(リンクにカーソルを合わせると、コンテンツの説明が表示されます)
用語集
Conversion Rate (CR): ウェブサイトやランディングページへの訪問者のうち、購入やニュースレターへの登録など、目的の行動を完了した人の割合。コンバージョン数を総訪問者数で割って算出する。
Cost of Goods Sold (COGS): 企業が販売する商品の生産に起因する直接費用。これには材料費と人件費が含まれ、流通費や販売員費用などの間接費用は含まれない。
Key Performance Indicator (KPI): a measurable value that demonstrates how effectively an organization is achieving key business objectives, often used to evaluate success at reaching targets.
Overall Equipment Effectiveness (OEE): 製造プロセスの効率性を評価するために用いられる指標で、稼働率、性能率、品質率を掛け合わせて算出される。これにより損失を特定し、生産性と業務効率の向上に繋げることができる。
Return on Investment (ROI): 投資の収益性を評価するために使用される財務指標で、投資による純利益を初期費用で割って算出され、パーセンテージで表されます。
Specific Measurable Achievable Relevant Timely (SMART): 明確で、定量化可能で、達成可能で、より広範な目標と整合し、期限が定められた目標を設定するための枠組みであり、効果的な計画立案と進捗状況の評価を促進する。
Takt Time: 顧客の需要を満たすために製品を生産するのに許容される最大時間。これは、利用可能な生産時間を必要な生産量で割ることによって算出されます。生産ペースを需要に合わせ、効率的なワークフローとリソース配分を確保するのに役立ちます。