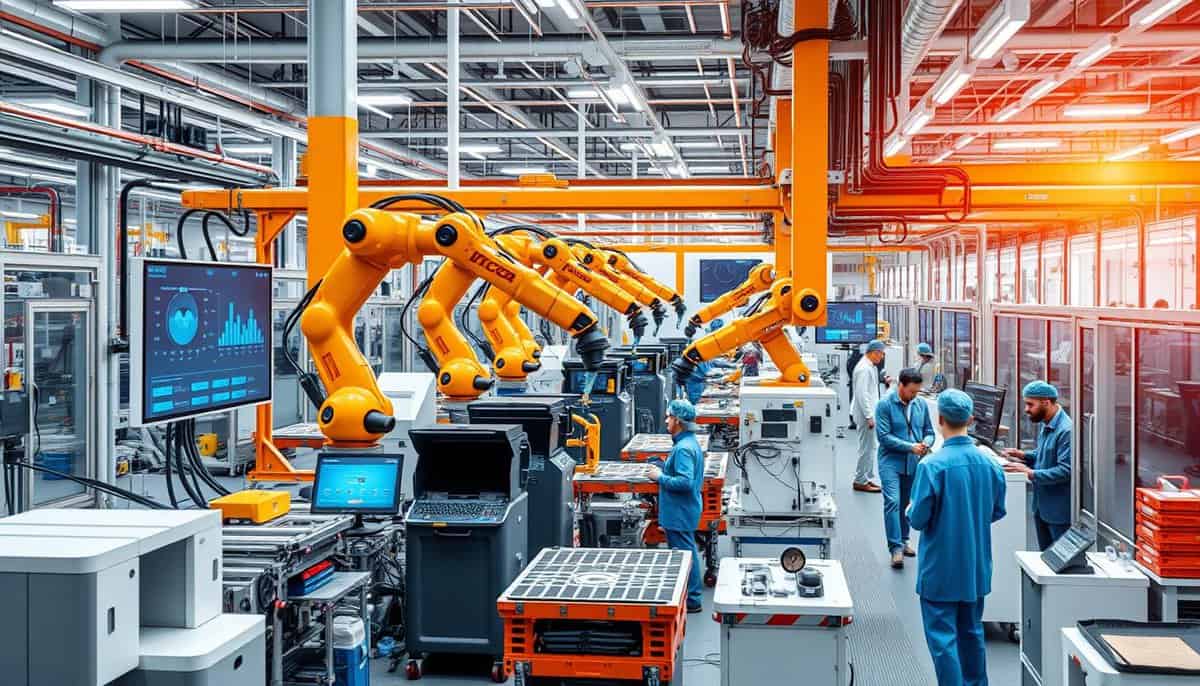
Are you making the most of every tool at your disposal to enhance production? Knowing and using the right Key Performance Indicators (KPIs) can change your operation’s success. These metrics help reduce downtime and plan production better, showing every part of the manufacturing process.
생산 관련 핵심성과지표(KPI)는 오늘날 제조업계에서 필수적입니다. KPI는 기업이 생산 단계를 모니터링, 분석 및 개선하는 데 도움을 줍니다. 종합설비효율(OEE), 재고회전율, 정시 납품률과 같은 지표를 통해 기업은 문제를 파악하고, 낭비를 줄이며, 미래의 수요를 예측할 수 있습니다. 이러한 지표는 시장 변화와 환경 변화에 적응하면서 생산을 목표 방향으로 이끌어 운영의 민첩성과 효율성을 높여줍니다.
핵심 요약
- KPI를 잘 활용하면 제조 효율성을 크게 향상시킬 수 있습니다.
- 종합 설비 효율(OEE)은 가용성, 성능 및 품질을 종합적으로 고려한 지표입니다.
- 재고 회전율을 낮추면 현금 흐름이 원활해지고 고객의 요구를 더 잘 충족할 수 있습니다.
- 정시 배송은 고객 만족과 직원 사기 진작에 매우 중요합니다.
- 고객 반품 추적은 생산상의 문제를 해결하는 데 매우 중요합니다.
생산 KPI란 무엇인가요?
생산 핵심성과지표(KPI)는 제조 분야에서 중요한 측정 지표입니다. 생산 공정이 얼마나 효율적으로 작동하는지를 추적하는 데 사용되며, 기업은 이를 통해 무엇이 효과적이고 무엇이 효과적이지 않은지 파악하여 운영을 개선하고 원활하게 만들 수 있습니다.
생산 KPI 정의
생산 KPI는 생산 공정이 목표를 얼마나 잘 달성하는지를 보여주는 수치입니다. 여기에는 사이클 시간, 처리량, 전반적인 설비 효율(OEE)과 같은 중요한 요소들이 포함됩니다. 이러한 지표들을 추적함으로써 기업은 생산 공정을 더욱 정밀하게 조정할 수 있으며, 진행 상황을 정확하게 측정할 수 있습니다.
KPI 추적의 중요성
KPI 추적의 가치는 매우 큽니다. KPI는 방대한 데이터를 유용한 인사이트로 바꿔줍니다. 정기적인 모니터링은 다음과 같은 여러 가지 이유로 중요합니다.
- 목표 설정 및 달성: KPI를 통해 명확한 목표를 설정할 수 있습니다. 이는 생산 라인이 회사의 목표에 부합하도록 유지하는 데 도움이 됩니다.
- 병목 현상 파악: KPI를 살펴보면 기업은 생산 차질을 신속하게 파악할 수 있습니다. 이를 통해 문제를 빠르게 해결하고 원활한 운영을 유지할 수 있습니다.
- 생산 공정 효율성 향상: KPI에 집중하면 기업의 효율성을 높일 수 있습니다. 즉, 비용을 절감하고 더 많은 제품을 생산할 수 있습니다.
KPI를 지속적으로 모니터링하면 제조업체는 성과를 개선할 수 있습니다. 이는 빠르게 변화하는 시장에서 앞서 나가기 위해 매우 중요합니다.
생산 KPI의 유형
생산 KPI는 크게 세 가지 유형으로 나뉩니다. 기계, 제품, 비용 효율성에 중점을 둡니다. 이러한 KPI 범주를 이해하면 생산 공정을 더 효과적으로 추적하고 개선할 수 있습니다.
기계 또는 자산 중심
이 KPI 유형은 기계 설비를 살펴봅니다. 자산 관리주요 지표는 다음과 같습니다.
- 장비 가동률: 이는 장비가 가동 상태로 유지되는 시간을 측정하는 지표입니다. 공식은 (총 장비 사용 시간 / 가용 생산 시간) * 100입니다. 목표는 장비 가동률을 90%로 유지하는 것입니다.
- 불량률: 이는 생산된 제품의 품질을 추적하는 지표입니다. 공식은 불량품 수 / 생산량 * 100입니다. 목표는 불량률을 낮추는 것입니다.
- 종합 설비 효율(OEE): 이는 기계의 작동 효율을 점검하는 것입니다. 공식은 (생산량 × 최대 사이클 시간) / 가용 생산 시간입니다. 우리는 올해 OEE를 5% 향상시키고자 합니다.
단위 또는 제품 중심
여기서 KPI는 제품 또는 생산량을 기준으로 생산 추이를 파악하는 데 도움을 줍니다. 포함된 지표는 다음과 같습니다.
- 사이클 시간이것이 하나의 생산 주기가 걸리는 시간입니다.
- 생산 능력 비율이것은 가능한 최대 생산량을 보여줍니다. 기계 용량률 * 시간으로 계산됩니다.
- 처리량이는 시간에 따른 제품 생산량을 측정합니다.
비용 중심
비용 중심 KPI는 생산 과정에서 비용을 절감하고 재정 상황을 파악하는 데 도움이 됩니다. 주요 지표는 다음과 같습니다.
- 단위당 생산 비용이는 제품 한 개를 생산하는 데 드는 비용을 측정하는 지표입니다. 공식은 총 제조 비용 / 생산량입니다. 목표는 2022년까지 제품 한 개당 생산 비용을 2센트 절감하는 것입니다.
- 단위 유지 비용이는 단위당 유지보수 비용을 살펴보는 것입니다. 총 유지보수 비용을 생산량으로 나누어 계산합니다. 올해 목표는 단위 유지보수 비용을 5% 절감하는 것입니다.
- 미사용 용량 비용이는 생산 능력을 최대한 활용하지 않을 경우 발생하는 비용 영향을 점검하는 것입니다. 공식은 미사용 생산 능력 비율 × 총 제조 비용입니다. 우리는 6개월 동안 미사용 생산 능력을 10% 줄이는 것을 목표로 합니다.
아래 표는 이러한 범주의 주요 지표를 보여줍니다.
| KPI 유형 | 미터법 | 공식 | 목표 예시 |
|---|---|---|---|
| 기계 또는 자산 중심 | 기계 가동률 | (총 기계 사용 시간 / 가용 생산 시간) * 100 | 각 장비의 가동률을 90%로 유지하십시오. |
| 단위 또는 제품 중심 | 생산능력비율 | 기계 용량률 * 시간 | 각 장비의 가동률이 90% 이상인지 확인하십시오. |
| 비용 중심 | 단위당 생산 비용 | 총 제조 비용 / 생산량 | 2022년까지 단위 생산 비용을 2센트 절감합니다. |
프로덕션의 핵심 성과 지표(KPI)
KPIs for production cover many metrics key for assessing manufacturing efficiency and productivity. These indicators provide data that helps manufacturing leaders make smart choices. They work to optimize operations, lower costs, and boost output. Knowing how to track manufacturing with key metrics is vital to compete today.

Several KPIs measure different aspects of production. They are crucial for quality assurance, equipment upkeep, cost control, and overall productivity. Key production KPIs include:
- Revenue: The total income from sales or services.
- Gross Profit Margin: The revenue percentage after removing the cost of goods sold.
- Return on Investment (투자수익률(ROI)): The profit to investment ratio.
- Customer Acquisition: The new customers gained within a period.
- Customer Retention: The rate of customers staying over time.
- Employee Satisfaction: How happy employees are in the company.
- Website Traffic: The site visitors count over time.
- Conversion Rate: The share of visitors who perform a desired action.
- Inventory Turnover: How often inventory is sold and replaced.
- Time to Market: The period to launch a new product.
Manufacturing-specific KPIs include:
- Count: the total products made.
- Reject ratio: the scrap production measure.
- Capacity utilization: how much production capacity is used.
- Rate: the speed of producing goods.
- Target: specific goals for production periods.
- 택트 타임: time needed to complete a task.
- 종합 설비 효율(OEE): the production equipment’s efficiency.
- Downtime: the time when production equipment is idle.
- Cycle time: the total time for a full production cycle.
- Lead time: the time for a product to go through production.
To monitor manufacturing well, finding the most crucial KPIs is key. Setting targets for each KPI, and consistently watching and analyzing KPI data, helps track progress and spot improvement areas. By using these indicators, manufacturers can get better results and stay ahead in the market.
| 미터법 | 정의 |
|---|---|
| OEE | Calculation: Availability x Performance x Quality |
| Total cycle time | Components: Production Time + Inspection Time + Transportation Time + Wait Time + Any Other Relevant Time |
| Throughput | Formula: Number of Units Produced ÷ Total Time of Production |
| 투자수익률(ROI) | Formula: (Total Investment / Net Profit) x 100 |
| On-time delivery | Formula: On-Time Units Delivered ÷ Total Units Delivered |
| Changeover time | Formula: Time to Produce First Quality Item – Time to Produce Last Quality Item |
| 생산하다 | Also known as FTT; Formula: (Total Items Produced – Defective Items) ÷ Items Produced |
| Scrap | Formula: Total Scrap ÷ Total Product Run |
| Customer return rate | Formula: Rejected Goods ÷ Total Number of Goods Delivered |
| Maintenance cost | Formula: (Maintenance Labor + Parts) ÷ Hours Running |
Top Production KPIs to Monitor
Monitoring production KPIs is key to manufacturing success. By focusing on important metrics, companies can see where they need to do better. They can improve how things work. Let’s look at four main production KPIs that manufacturers can’t do without.
사이클 타임
Cycle time measures how long making a product takes, from beginning to end. This KPI shows how fast products are made. It spots slowdowns in making goods. Watching and cutting down cycle time boosts manufacturing speed and efficiency.
Throughput Rate
The throughput rate tells how many items are made in a set time. It shows if a production line is doing well. A high rate means things are running smoothly. Yet, it’s important to keep making high-quality products.

Production Attainment
Production attainment compares what was actually made to the goals. It’s vital for checking if manufacturing aims are reached. A high rate means good progress. A low rate might show problems that need to be fixed.
종합 설비 효율(OEE)
Overall Equipment Effectiveness (OEE) looks at three key parts: how available, performant, and quality the equipment is. The best factories score about 85% on OEE. Most companies score between 40% and 60%. Keeping an eye on OEE ensures machines work well and downtime is minimal. Forbes says downtime can cost companies $50 billion a year.
| KPI | 정의 | Importance |
|---|---|---|
| 사이클 시간 | Time to complete one production cycle | Identifies bottlenecks and improves speed |
| 처리량 | Units produced over time | Assesses production capacity and efficiency |
| Production attainment | Actual output vs. planned targets | Tracks progress against goals |
| 종합 설비 효율(OEE) | Combines availability, performance, quality | Maximizes equipment efficiency and uptime |
How to Calculate Essential Production KPIs
Achieving manufacturing excellence means knowing your key performance indicators (KPIs) well. Using KPI calculation effectively and setting the right KPI targets help make smart choices and improve operations. Let’s explore important performance metrics formulas and look at examples.
Formulas for Calculating KPIs
It’s crucial to understand the formulas for production KPIs. This knowledge helps measure and track accurately. Here are some essential KPIs and their performance metrics formulas:
- 사이클 시간: cycle Time = Process End Time – Process Start Time
- Asset utilization: (Actual Output / Maximum Capacity) x 100
- Opportunity gap: Maximum Capacity – Actual Output
- 종합 설비 효율(OEE): Availability x Performance x Quality
- Capacity utilization: Actual Factory Utilization / Total Productive Capacity
- On-time delivery: Number of units ordered / Number of orders delivered on time
- 처리량: Production Time / Number of Units Produced
Examples of KPI Goals
After mastering KPI calculation, setting KPI targets in line with your goals is the next step. Here are examples of goals to aim for:
- Reduce cycle time: work to cut cycle time by 10% in the coming quarter.
- Improve asset utilization: boost asset use to 85% for better efficiency.
- Enhance on-time delivery: raise the on-time delivery rate to 95% to please customers.
- Optimize OEE: aim for an OEE score of 80% by tackling downtime and quality issues.
Below is a detailed table showing key KPIs, their formulas, and targets:
| KPI | 공식 | Target Goal |
|---|---|---|
| 사이클 타임 | Process End Time – Process Start Time | Reduce by 10% |
| Asset Utilization | (Actual Output/Maximum Capacity) x 100% | Increase to 85% |
| Opportunity Gap | Maximum Capacity – Actual Output | Minimize gap by 15% |
| 종합 설비 효율(OEE) | Availability x Performance x Quality | Achieve 80% |
| Capacity Utilization | Actual Factory Utilization/Total Productive Capacity | Maximize to 90% |
| On-time Delivery | Number of units ordered / Number of orders delivered on time | Reach 95% |
Common Challenges in Measuring Production KPIs
It’s important for organizations to measure production KPIs to improve efficiency. But, measuring KPIs has its challenges. One main challenge is ensuring the data is right.
Problems like mistakes, double entries, and old info can harm KPI efforts. Data silos make it worse by splitting up the data. This can cause wrong decisions.
For better decision-making, companies need strong data management. They should use new tech and focus on data. Choosing the best KPIs is also hard but crucial.
Organizations get overwhelmed by too many metrics, which can confuse their KPI strategy. KPIs should match the company’s goals. Teams must work together and understand their business well.
Setting realistic goals is another big hurdle. Unrealistic targets can make employees feel bad, leading to missed goals. It’s better to aim for small wins than impossible goals.
Tracking metrics like sales growth, customer happiness, and team efficiency is vital. These KPIs show where a business stands. They help spot strengths and areas to improve.
With the right data and analysis, companies can see why they’re doing well or not. KPIs can also aid in doing a 맹렬한 공부 analysis, giving a full picture of performance.
| Challenge | 세부 |
|---|---|
| Data Quality Issues | Inaccuracies, inconsistencies, and incompleteness in data. |
| Data Silos | Fragmented data landscape within organizations. |
| Selecting Relevant KPIs | Difficulty in choosing specific, measurable, and contextually relevant metrics. |
| Achievable Targets | Risk of demotivation from unattainable goals. |
To beat these challenges, companies should train their teams well. Good training helps keep data correct and makes KPIs useful. Overcoming these issues is key to getting reliable insights and hitting production goals.
Best Practices for Implementing KPI Dashboards
Implementing effective KPI dashboards is key to boosting production and making data-driven decisions. They should be user-friendly and integrate real-time manufacturing data. This way, organizations can gain insights to improve their operations.
Designing Effective Dashboards
Designing a KPI dashboard requires understanding the users and their needs. It should focus on simplicity, ease of use, and clear information layout. These aspects ensure users can quickly understand data and make decisions.
High-level insights come from strategic dashboards, helpful for top management. Operational dashboards, on the other hand, provide real-time data for daily decision-making. Choosing the right software, like Klipfolio or Tableau, lets organizations customize dashboards to their needs.
Using Real-Time Data for Insights
Real-time data in KPI dashboards spot issues and opportunities instantly. Operational dashboards show live updates, helping to adjust quickly and improve constantly.
A KPI Institute study found 68% of companies with a KPI strategy saw business improvements. Analytical dashboards dive deep into data for root causes, while tactical dashboards track goal progress. This helps everyone in the organization aim for excellence.
Setting SMART KPI targets helps ensure goals are clear and achievable. For example, a 사이버 보안 firm might aim for 50,000 monthly visitors, tracking time on site and bounce rates as success metrics.
Well-designed KPI dashboards, aligned with goals, enhance data knowledge and a culture of improvement. This leads to better efficiency and business growth.
자주 묻는 질문
생산 KPI란 무엇이며 왜 중요한가요?
생산 핵심성과지표(KPI)는 제조 공정의 성공 여부를 측정합니다. 이는 효율성 측정, 문제점 파악, 목표 달성에 필수적이며, 전체 운영 성과 향상에 기여합니다.
어떤 유형의 생산 KPI를 모니터링해야 할까요?
생산 KPI에는 세 가지 유형이 있습니다. 첫째는 기계 가동 시간과 같은 기계 또는 자산 중심 KPI입니다. 둘째는 처리량과 같은 단위 또는 제품 중심 KPI입니다. 셋째는 단위 생산 비용과 같은 비용 중심 KPI입니다. 이러한 KPI를 지속적으로 모니터링하면 생산성을 향상시키는 데 도움이 됩니다.
핵심 생산 KPI는 어떻게 계산하나요?
생산 KPI 계산에는 특정 공식이 사용됩니다. 사이클 타임의 경우, 생산 종료 시간에서 생산 시작 시간을 빼면 됩니다. 이러한 계산 방법을 통해 명확한 목표를 설정하고 개선 사항을 추적할 수 있습니다.
제조 효율성을 모니터링하기 위해 가장 중요한 생산 KPI는 무엇입니까?
주요 KPI에는 사이클 타임과 처리량, 생산 달성률 및 전반적인 설비 효율(OEE)이 포함됩니다. 이러한 지표들은 제조 공정의 속도, 효율성 및 생산량을 보여줍니다.
생산 및 품질 최적화 관련 외부 링크
국제 표준
(링크 위에 마우스를 올려놓으면 콘텐츠에 대한 설명을 볼 수 있습니다.)
사용된 용어집
Conversion Rate (CR): 웹사이트 또는 랜딩 페이지 방문자 중 구매 또는 뉴스레터 구독과 같은 원하는 행동을 완료한 방문자의 비율로, 전환 수를 전체 방문자 수로 나누어 계산합니다.
Cost of Goods Sold (COGS): 기업이 판매하는 상품 생산에 직접적으로 발생하는 비용(재료비 및 인건비 포함)으로, 유통비 및 영업비와 같은 간접비는 제외한 금액입니다.
Key Performance Indicator (KPI): a measurable value that demonstrates how effectively an organization is achieving key business objectives, often used to evaluate success at reaching targets.
Overall Equipment Effectiveness (OEE): 제조 공정의 효율성을 평가하는 데 사용되는 지표로, 가용성, 성능 및 품질 비율을 곱하여 계산됩니다. 이를 통해 손실을 파악하고 생산성 및 운영 효율성을 개선할 수 있습니다.
Return on Investment (ROI): 투자 수익성을 평가하는 데 사용되는 재무 지표로, 투자 순이익을 초기 비용으로 나눈 값이며 백분율로 표시됩니다.
Specific Measurable Achievable Relevant Timely (SMART): 명확하고, 정량화 가능하며, 달성 가능하고, 더 광범위한 목표와 일치하며, 시간 제한이 있는 목표를 설정하기 위한 프레임워크로, 효과적인 계획 수립 및 진행 상황 평가를 용이하게 합니다.
Takt Time: 고객 수요를 충족하기 위해 제품을 생산하는 데 허용되는 최대 시간은 가용 생산 시간을 필요한 생산량으로 나누어 계산합니다. 이는 생산 속도를 수요에 맞춰 조정하여 효율적인 작업 흐름과 자원 배분을 보장하는 데 도움이 됩니다.