Product Design, Manufacturing & Innovation Resources
Home » Signal Detection using Disproportionality Analysis

Signal Detection using Disproportionality Analysis

1990
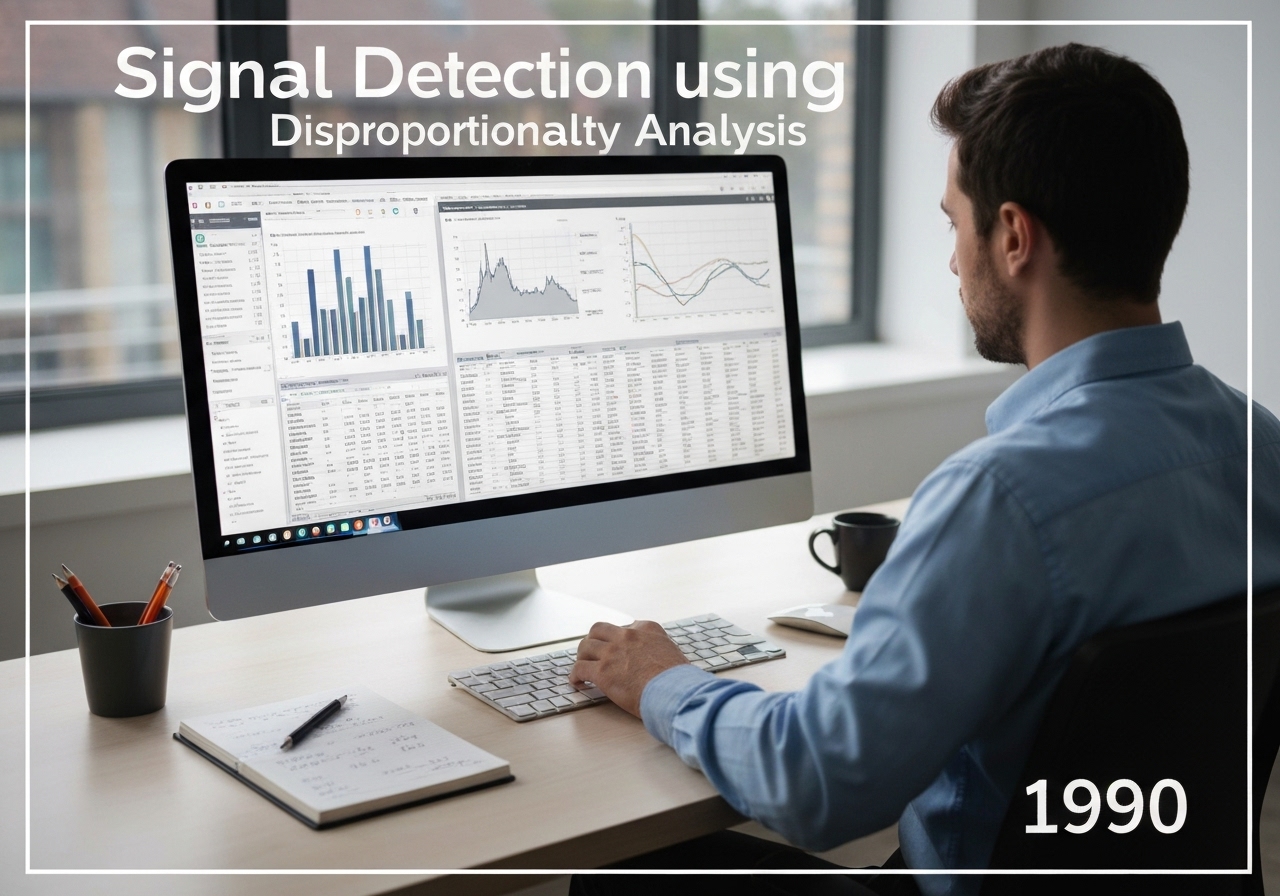
Statistician analyzing drug safety data using disproportionality analysis in a modern office.

(generated image for illustration only)

Signal detection is the process of identifying potential causal relationships between a drug and an adverse event from large datasets, typically spontaneous reporting systems. It uses statistical methods, known as disproportionality analysis, to find drug-event combinations reported more frequently than expected. A common measure is the Reporting Odds Ratio (ROR), a value greater than one suggesting a potential signal that requires further investigation.


Disproportionality analysis is a core data mining technique in modern pharmacovigilance. It addresses the challenge of finding a ‘needle in a haystack’ within massive spontaneous reporting databases containing millions of reports. The fundamental idea is to compare the proportion of reports for a specific adverse event with a specific drug to the proportion of reports for that same event with all other drugs in the database. If a drug-event pair appears significantly more often than would be expected by chance, it is flagged as a ‘signal’ of a potential association.

This is typically calculated using a 2×2 contingency table. For a given drug (Drug X) and event (Event Y), the table contains four cells: (a) reports with Drug X and Event Y, (b) reports with Drug X and any other event, (c) reports with any other drug and Event Y, and (d) reports with any other drug and any other event. The Reporting Odds Ratio (ROR) is then calculated as \((a/c) / (b/d) = ad/bc\). A ROR value significantly greater than 1, along with a sufficient number of cases, suggests a statistical association.

Other common measures include the Proportional Reporting Ratio (PRR) and Bayesian methods like the Multi-item Gamma Poisson Shrinker (MGPS). It is crucial to understand that these methods do not establish causality. They are hypothesis-generating tools. A statistical signal can be influenced by many biases, such as media attention (the ‘Weber effect’), co-prescribed medications, or the underlying disease being treated. Therefore, any detected signal must undergo a thorough qualitative and clinical assessment by experts before any regulatory action is considered.

UNESCO Nomenclature: 1209
– Statistics

Type

Software/Algorithm

Disruption

Substantial

Usage

Widespread Use

Precursors

  • the establishment of large-scale spontaneous reporting databases
  • advances in computational power and data mining techniques
  • foundational principles of epidemiology and biostatistics
  • the bayesian statistical framework

Applications

  • prioritizing which drug-safety issues require in-depth investigation
  • automated screening of large adverse event databases like FAERS and VigiBase
  • providing early warnings about potential drug hazards
  • supporting regulatory decision-making on drug safety communications

Patents:

NA

Potential Innovations Ideas

  • machine learning algorithms that incorporate clinical notes and patient demographics to refine signal detection
  • temporal disproportionality analysis to detect signals that only appear after long-term drug use
  • integration of real-world evidence from electronic health records to validate statistical signals
  • network analysis to identify complex drug-drug-event interaction signals
  • development of signal detection methods specifically for biologic drugs and gene therapies
  • ai-powered systems to automatically search medical literature for corroborating evidence for a new signal
  • quantum computing algorithms to screen for multi-drug interactions at unprecedented scale
  • a personalized signal detection system that alerts clinicians to potential ADRs based on their specific patient’s profile
  • using natural language processing on social media to detect patient-reported signals before they appear in official databases
  • automated signal detection for medical device adverse events
Related to: signal detection, disproportionality analysis, proportional reporting ratio, PRR, reporting odds ratio, ROR, data mining, pharmacovigilance, VigiBase, pharmacoepidemiology.

Historical Context

Signal Detection using Disproportionality Analysis

1980
1980
1986-01-01
1990
1990
1993
1998
1980
1980
1982-07-01
1988-06-01
1990
1993
1997-04-23
2001

(if date is unknown or not relevant, e.g. "fluid mechanics", a rounded estimation of its notable emergence is provided)

10th year anniversary

Full size images and downloads are only available, 100% free, for registered members.

> Login <