Product Design, Manufacturing & Innovation Resources
Heim » Signal Detection using Disproportionality Analysis

Signal Detection using Disproportionality Analysis

1990
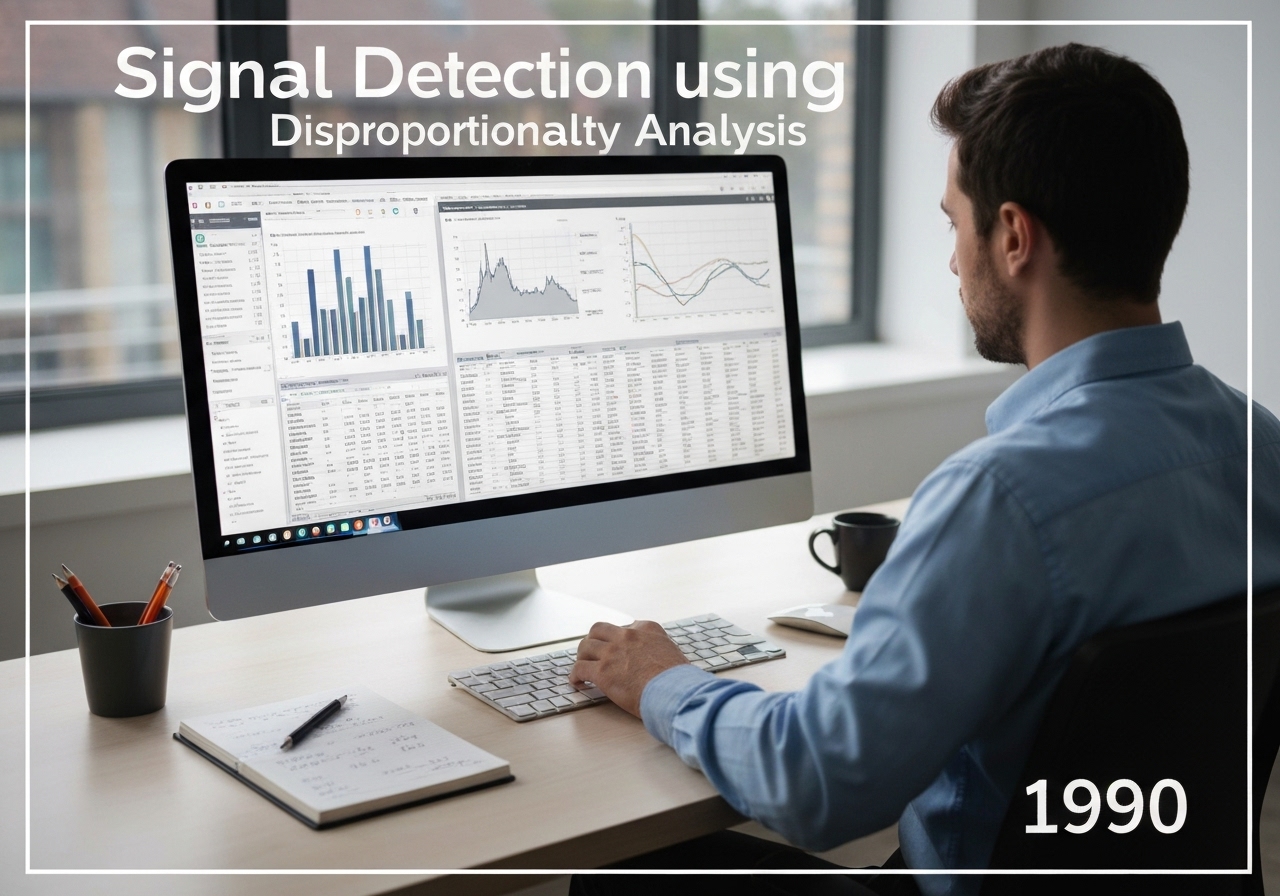
Statistician analyzing drug safety data using disproportionality analysis in a modern office.

(Abbildung dient nur zur Veranschaulichung)

Signal detection is the process of identifying potential causal relationships between a drug and an adverse event from large datasets, typically spontaneous reporting systems. It uses statistical methods, known as disproportionality analysis, to find drug-event combinations reported more frequently than expected. A common measure is the Reporting Odds Ratio (ROR), a value greater than one suggesting a potential signal that requires further investigation.


Disproportionality analysis is a core data mining technique in modern pharmacovigilance. It addresses the challenge of finding a ‘needle in a haystack’ within massive spontaneous reporting databases containing millions of reports. The fundamental idea is to compare the proportion of reports for a specific adverse event with a specific drug to the proportion of reports for that same event with all other drugs in the database. If a drug-event pair appears significantly more often than would be expected by chance, it is flagged as a ‘signal’ of a potential association.

Die Berechnung erfolgt üblicherweise mithilfe einer 2 ×2-Kontingenztabelle. Für ein bestimmtes Medikament (Medikament X) und Ereignis (Ereignis Y) enthält die Tabelle vier Zellen: (a) Meldungen mit Medikament X und Ereignis Y, (b) Meldungen mit Medikament X und einem beliebigen anderen Ereignis, (c) Meldungen mit einem beliebigen anderen Medikament und Ereignis Y sowie (d) Meldungen mit einem beliebigen anderen Medikament und einem beliebigen anderen Ereignis. Die Meldequote (Reporting Odds Ratio, ROR) wird dann wie folgt berechnet: (a/c) / (b/d) = ad/bc. Ein ROR-Wert deutlich über 1 deutet in Verbindung mit einer ausreichenden Fallzahl auf einen statistischen Zusammenhang hin.

Weitere gängige Kennzahlen sind die Proportional Reporting Ratio (PRR) und Bayes'sche Methoden wie der Multi-Item Gamma Poisson Shrinker (MGPS). Es ist wichtig zu verstehen, dass diese Methoden keine Kausalität beweisen. Sie dienen der Hypothesengenerierung. Ein statistisches Signal kann von vielen Faktoren beeinflusst werden. VerzerrungenFaktoren wie Medienaufmerksamkeit (der sogenannte „Weber-Effekt“), gleichzeitig verschriebene Medikamente oder die zugrunde liegende Erkrankung können eine Rolle spielen. Daher muss jedes festgestellte Signal einer gründlichen qualitativen und klinischen Bewertung durch Experten unterzogen werden, bevor regulatorische Maßnahmen in Erwägung gezogen werden.

UNESCO Nomenclature: 1209
– Statistics

Typ

Software/Algorithm

Störung

Wesentliche

Verwendung

Weitverbreitete Verwendung

Vorläufer

  • the establishment of large-scale spontaneous reporting databases
  • advances in computational power and data mining techniques
  • foundational principles of epidemiology and biostatistics
  • the bayesian statistical framework

Anwendungen

  • prioritizing which drug-safety issues require in-depth investigation
  • automated screening of large adverse event databases like FAERS and VigiBase
  • providing early warnings about potential drug hazards
  • supporting regulatory decision-making on drug safety communications

Patente:

NA

Potenzielle Innovationsideen

  • machine learning algorithms that incorporate clinical notes and patient demographics to refine signal detection
  • temporal disproportionality analysis to detect signals that only appear after long-term drug use
  • integration of real-world evidence from electronic health records to validate statistical signals
  • network analysis to identify complex drug-drug-event interaction signals
  • development of signal detection methods specifically for biologic drugs and gene therapies
  • ai-powered systems to automatically search medical literature for corroborating evidence for a new signal
  • quantum computing algorithms to screen for multi-drug interactions at unprecedented scale
  • a personalized signal detection system that alerts clinicians to potential ADRs based on their specific patient’s profile
  • mit natural language processing on social media to detect patient-reported signals before they appear in official databases
  • automated signal detection for Medizinprodukt adverse events
Verwandt mit: Signalerkennung, Disproportionalitätsanalyse, proportionales Meldeverhältnis (PRR), Melde-Odds-Ratio (ROR), Data Mining, Pharmakovigilanz, VigiBase, Pharmakoepidemiologie.

Historischer Kontext

Signal Detection using Disproportionality Analysis

1980
1980
1986-01-01
1990
1990
1993
1998
1980
1980
1982-07-01
1988-06-01
1990
1993
1997-04-23
2001

(wenn das Datum unbekannt oder nicht relevant ist, z. B. „Strömungsmechanik“, wird eine gerundete Schätzung seines bemerkenswerten Auftretens bereitgestellt)

10. Jahr Jubiläum

Bilder in voller Größe und Downloads sind ausschließlich für registrierte Mitglieder kostenlos verfügbar.

> Login <