Product Design, Manufacturing & Innovation Resources
家 » 利用不比例分析进行信号检测

利用不比例分析进行信号检测

1990
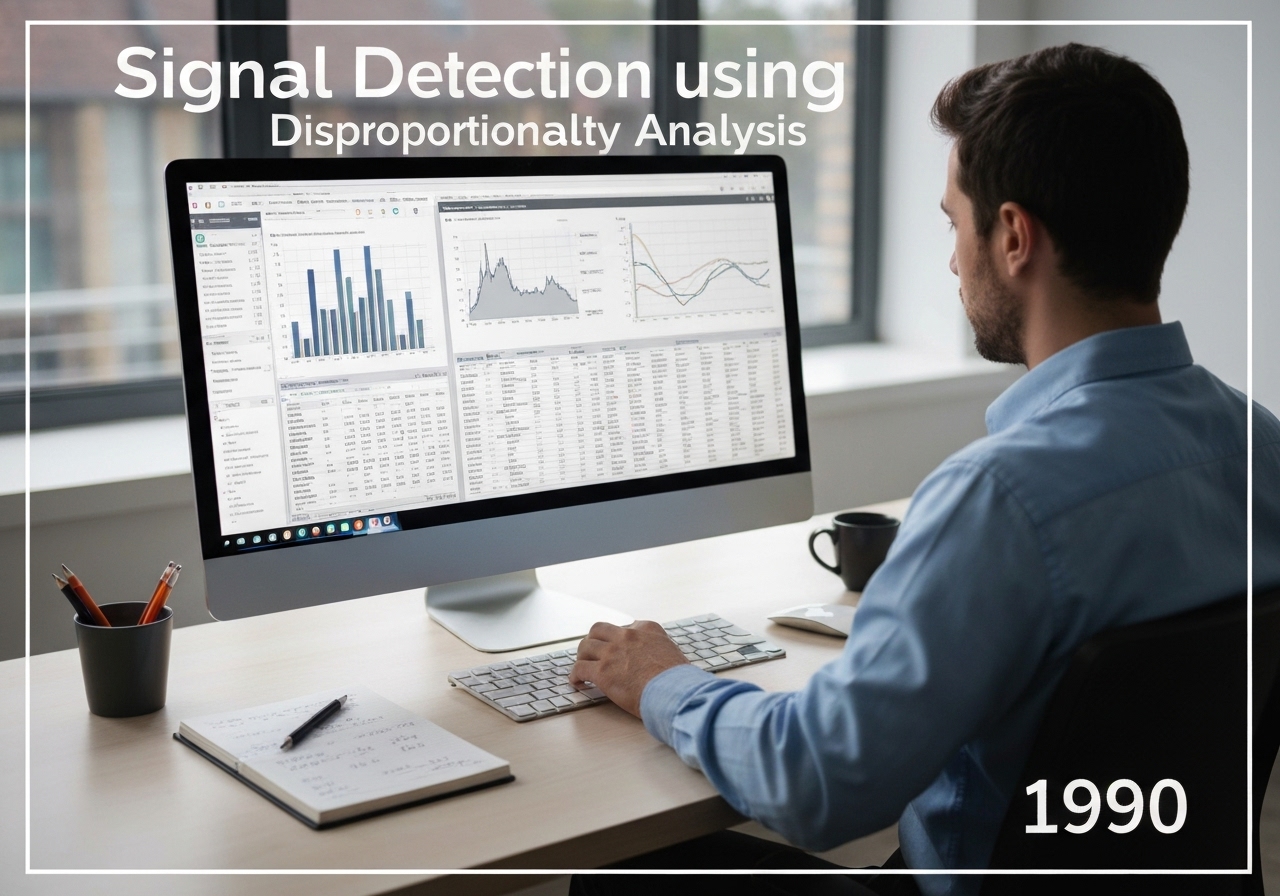
Statistician analyzing drug safety data using disproportionality analysis in a modern office.

(图片仅供参考)

Signal detection is the process of identifying potential causal relationships between a drug and an adverse event from large datasets, typically spontaneous reporting systems. It uses statistical methods, known as disproportionality analysis, to find drug-event combinations reported more frequently than expected. A common measure is the Reporting Odds Ratio (ROR), a value greater than one suggesting a potential signal that requires further investigation.


Disproportionality analysis is a core data mining technique in modern pharmacovigilance. It addresses the challenge of finding a ‘needle in a haystack’ within massive spontaneous reporting databases containing millions of reports. The fundamental idea is to compare the proportion of reports for a specific adverse event with a specific drug to the proportion of reports for that same event with all other drugs in the database. If a drug-event pair appears significantly more often than would be expected by chance, it is flagged as a ‘signal’ of a potential association.

This is typically calculated using a 2×2 contingency table. For a given drug (Drug X) and event (Event Y), the table contains four cells: (a) reports with Drug X and Event Y, (b) reports with Drug X and any other event, (c) reports with any other drug and Event Y, and (d) reports with any other drug and any other event. The Reporting Odds Ratio (ROR) is then calculated as [latex](a/c) / (b/d) = ad/bc[/latex]. A ROR value significantly greater than 1, along with a sufficient number of cases, suggests a statistical association.

Other common measures include the Proportional Reporting Ratio (PRR) and Bayesian methods like the Multi-item Gamma Poisson Shrinker (MGPS). It is crucial to understand that these methods do not establish causality. They are hypothesis-generating tools. A statistical signal can be influenced by many 偏见, such as media attention (the ‘Weber effect’), co-prescribed medications, or the underlying disease being treated. Therefore, any detected signal must undergo a thorough qualitative and clinical assessment by experts before any regulatory action is considered.

UNESCO Nomenclature: 1209
– Statistics

类型

Software/Algorithm

中断

重大的

用法

广泛使用

前体

  • the establishment of large-scale spontaneous reporting databases
  • 计算能力和数据挖掘技术的进步
  • 流行病学和生物统计学的基本原理
  • 贝叶斯统计框架

应用程序

  • 确定需要深入调查的药品安全问题的优先次序
  • 自动筛选大型不良事件数据库,如 FAERS 和 VigiBase
  • 提供有关潜在药物危害的早期预警
  • 支持药品安全沟通监管决策

专利:

NA

潜在创新理念

  • 机器学习算法结合临床记录和患者人口统计数据来改进信号检测
  • 时间不比例分析,检测仅在长期吸毒后出现的信号
  • 整合电子健康记录中的真实世界证据来验证统计信号
  • 网络分析识别复杂的药物-药物-事件相互作用信号
  • 专门针对生物药物和基因治疗的信号检测方法的开发
  • 人工智能系统自动搜索医学文献,为新信号寻找佐证
  • 量子计算算法以前所未有的规模筛选多药物相互作用
  • a personalized signal detection system that alerts clinicians to potential ADRs based on their specific patient’s profile
  • 使用 natural language processing on social media to detect patient-reported signals before they appear in official databases
  • automated signal detection for 医疗器械 adverse events
Related to: signal detection, disproportionality analysis, proportional reporting ratio, PRR, reporting odds ratio, ROR, data mining, pharmacovigilance, VigiBase, pharmacoepidemiology.

历史背景

利用不比例分析进行信号检测

1980
1980
1986-01-01
1990
1990
1993
1998
1980
1980
1982-07-01
1988-06-01
1990
1993
1997-04-23
2001

(如果日期未知或不相关,例如“流体力学”,则提供其显著出现的近似估计)

第十年 周年纪念日

只有注册会员才能免费获取完整尺寸的图片和下载内容。

> 登录 <