Product Design, Manufacturing & Innovation Resources
घर » असमानता विश्लेषण का उपयोग करके सिग्नल डिटेक्शन

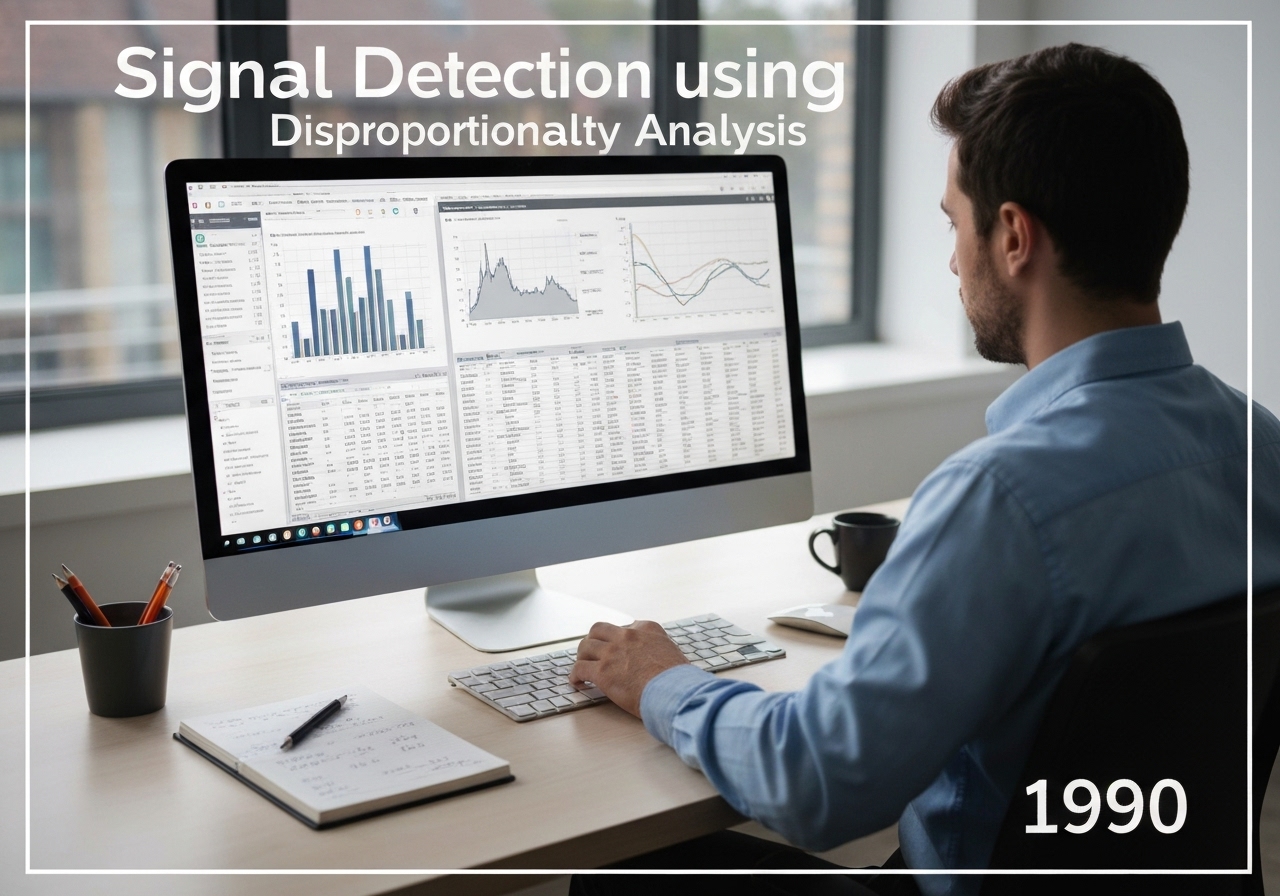
असमानता विश्लेषण का उपयोग करके सिग्नल डिटेक्शन

1990
Statistician analyzing drug safety data using disproportionality analysis in a modern office.

(यह छवि केवल उदाहरण के लिए बनाई गई है)

Signal detection is the process of identifying potential causal relationships between a drug and an adverse event from large datasets, typically spontaneous reporting systems. It uses statistical methods, known as disproportionality analysis, to find drug-event combinations reported more frequently than expected. A common measure is the Reporting Odds Ratio (ROR), a value greater than one suggesting a potential signal that requires further investigation.


Disproportionality analysis is a core data mining technique in modern pharmacovigilance. It addresses the challenge of finding a ‘needle in a haystack’ within massive spontaneous reporting databases containing millions of reports. The fundamental idea is to compare the proportion of reports for a specific adverse event with a specific drug to the proportion of reports for that same event with all other drugs in the database. If a drug-event pair appears significantly more often than would be expected by chance, it is flagged as a ‘signal’ of a potential association.

इसकी गणना आमतौर पर 2×2 कंटिंजेंसी टेबल का उपयोग करके की जाती है। किसी दी गई दवा (ड्रग X) और घटना (इवेंट Y) के लिए, टेबल में चार सेल होते हैं: (a) ड्रग X और इवेंट Y वाली रिपोर्ट, (b) ड्रग X और किसी अन्य घटना वाली रिपोर्ट, (c) किसी अन्य दवा और इवेंट Y वाली रिपोर्ट, और (d) किसी अन्य दवा और किसी अन्य घटना वाली रिपोर्ट। रिपोर्टिंग ऑड्स रेशियो (ROR) की गणना [latex](a/c) / (b/d) = ad/bc[/latex] के रूप में की जाती है। 1 से काफी अधिक ROR मान, पर्याप्त संख्या में मामलों के साथ, एक सांख्यिकीय संबंध का सुझाव देता है।

अन्य सामान्य मापों में आनुपातिक रिपोर्टिंग अनुपात (PRR) और मल्टी-आइटम गामा पॉइसन श्रिंकर (MGPS) जैसी बायेसियन विधियाँ शामिल हैं। यह समझना महत्वपूर्ण है कि ये विधियाँ कार्य-कारण संबंध स्थापित नहीं करतीं। ये परिकल्पना-उत्पादक उपकरण हैं। एक सांख्यिकीय संकेत कई कारकों से प्रभावित हो सकता है। पूर्वाग्रहोंजैसे कि मीडिया का ध्यान (''वेबर प्रभाव''), साथ में ली जाने वाली दवाएं, या जिस अंतर्निहित बीमारी का इलाज किया जा रहा है। इसलिए, किसी भी नियामक कार्रवाई पर विचार करने से पहले, किसी भी पहचाने गए संकेत का विशेषज्ञों द्वारा गहन गुणात्मक और नैदानिक ​​मूल्यांकन किया जाना चाहिए।

UNESCO Nomenclature: 1209
सांख्यिकी

Type

सॉफ्टवेयर/एल्गोरिदम

व्यवधान

संतोषजनक

उपयोग

व्यापक उपयोग

शगुन

  • the establishment of large-scale spontaneous reporting databases
  • गणना शक्ति और डेटा माइनिंग तकनीकों में प्रगति
  • महामारी विज्ञान और जैवसांख्यिकी के मूलभूत सिद्धांत
  • बेयसियन सांख्यिकीय ढांचा

आवेदन

  • यह तय करना कि किन दवा-सुरक्षा संबंधी मुद्दों पर गहन जांच की आवश्यकता है
  • FAERS और VigiBase जैसे बड़े प्रतिकूल घटना डेटाबेस की स्वचालित स्क्रीनिंग
  • संभावित दवा संबंधी खतरों के बारे में प्रारंभिक चेतावनी प्रदान करना
  • दवा सुरक्षा संचार पर नियामक निर्णय लेने में सहायता करना

पेटेंट:

NA

संभावित नवाचार विचार

  • machine learning algorithms that incorporate clinical notes and patient demographics to refine signal detection
  • temporal disproportionality analysis to detect signals that only appear after long-term drug use
  • integration of real-world evidence from electronic health records to validate statistical signals
  • network analysis to identify complex drug-drug-event interaction signals
  • development of signal detection methods specifically for biologic drugs and gene therapies
  • ai-powered systems to automatically search medical literature for corroborating evidence for a new signal
  • quantum computing algorithms to screen for multi-drug interactions at unprecedented scale
  • a personalized signal detection system that alerts clinicians to potential ADRs based on their specific patient’s profile
  • का उपयोग करते हुए प्राकृतिक भाषा प्रसंस्करण on social media to detect patient-reported signals before they appear in official databases
  • automated signal detection for चिकित्सा उपकरण adverse events
संबंधित विषय: सिग्नल डिटेक्शन, असमानता विश्लेषण, आनुपातिक रिपोर्टिंग अनुपात (पीआरआर), रिपोर्टिंग ऑड्स अनुपात (आरओआर), डेटा माइनिंग, फार्माकोविजिलेंस, विजीबेस, फार्माकोएपिडेमियोलॉजी।

ऐतिहासिक संदर्भ

असमानता विश्लेषण का उपयोग करके सिग्नल डिटेक्शन

1980
1980
1986-01-01
1990
1990
1993
1998
1980
1980
1982-07-01
1988-06-01
1990
1993
1997-04-23
2001

(यदि तिथि अज्ञात है या प्रासंगिक नहीं है, उदाहरण के लिए "द्रव यांत्रिकी", तो इसके उल्लेखनीय उद्भव का एक अनुमानित आंकड़ा प्रदान किया गया है)

नवीनतम परिवर्धन

शीर्ष पोस्ट और लेख

शीर्ष मूल उपकरण

10वां वर्ष सालगिरह

पंजीकृत सदस्यों के लिए पूर्ण आकार की छवियाँ और डाउनलोड 100% निःशुल्क उपलब्ध हैं।