Product Design, Manufacturing & Innovation Resources
Casa » Signal Detection using Disproportionality Analysis

Signal Detection using Disproportionality Analysis

1990
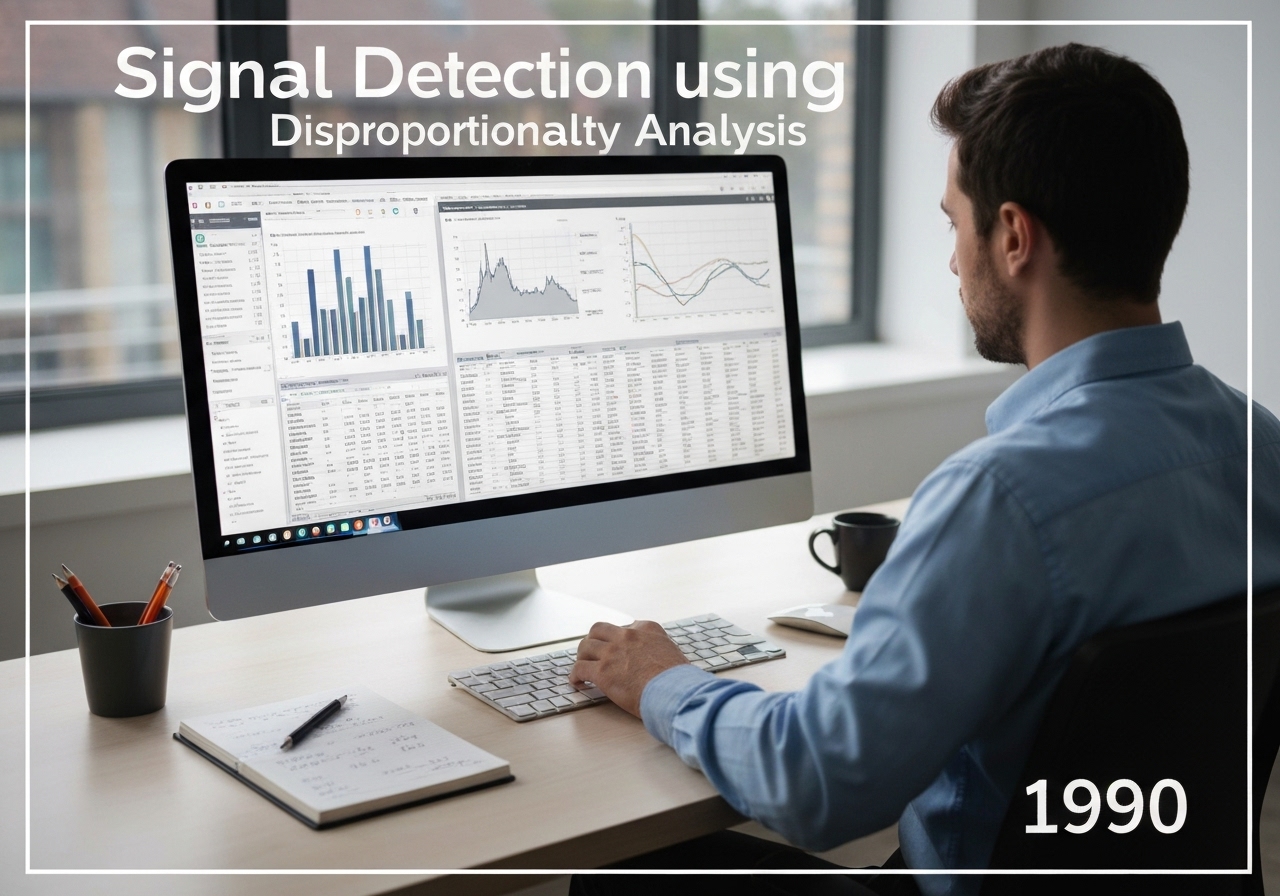
Statistician analyzing drug safety data using disproportionality analysis in a modern office.

(Immagine generata a solo scopo illustrativo)

Signal detection is the process of identifying potential causal relationships between a drug and an adverse event from large datasets, typically spontaneous reporting systems. It uses statistical methods, known as disproportionality analysis, to find drug-event combinations reported more frequently than expected. A common measure is the Reporting Odds Ratio (ROR), a value greater than one suggesting a potential signal that requires further investigation.


Disproportionality analysis is a core data mining technique in modern pharmacovigilance. It addresses the challenge of finding a ‘needle in a haystack’ within massive spontaneous reporting databases containing millions of reports. The fundamental idea is to compare the proportion of reports for a specific adverse event with a specific drug to the proportion of reports for that same event with all other drugs in the database. If a drug-event pair appears significantly more often than would be expected by chance, it is flagged as a ‘signal’ of a potential association.

Questo valore viene tipicamente calcolato utilizzando una tabella di contingenza 2×2. Per un dato farmaco (Farmaco X) ed evento (Evento Y), la tabella contiene quattro celle: (a) segnalazioni con Farmaco X ed Evento Y, (b) segnalazioni con Farmaco X e qualsiasi altro evento, (c) segnalazioni con qualsiasi altro farmaco ed Evento Y e (d) segnalazioni con qualsiasi altro farmaco e qualsiasi altro evento. Il Reporting Odds Ratio (ROR) viene quindi calcolato come [latex](a/c) / (b/d) = ad/bc[/latex]. Un valore di ROR significativamente maggiore di 1, insieme a un numero sufficiente di casi, suggerisce un'associazione statistica.

Altre misure comuni includono il Proportional Reporting Ratio (PRR) e metodi bayesiani come il Multi-item Gamma Poisson Shrinker (MGPS). È fondamentale comprendere che questi metodi non stabiliscono la causalità. Sono strumenti per generare ipotesi. Un segnale statistico può essere influenzato da molti fattori. pregiudizicome l'attenzione dei media (l'"effetto Weber"), i farmaci prescritti contemporaneamente o la patologia di base in trattamento. Pertanto, qualsiasi segnale rilevato deve essere sottoposto a un'accurata valutazione qualitativa e clinica da parte di esperti prima che venga presa in considerazione qualsiasi azione normativa.

UNESCO Nomenclature: 1209
– Statistics

Tipo

Software/Algorithm

Interruzione

Sostanziale

Utilizzo

Uso diffuso

Precursori

  • the establishment of large-scale spontaneous reporting databases
  • advances in computational power and data mining techniques
  • foundational principles of epidemiology and biostatistics
  • the bayesian statistical framework

Applicazioni

  • prioritizing which drug-safety issues require in-depth investigation
  • automated screening of large adverse event databases like FAERS and VigiBase
  • providing early warnings about potential drug hazards
  • supporting regulatory decision-making on drug safety communications

Brevetti:

NA

Idee e potenziali innovazioni

  • machine learning algorithms that incorporate clinical notes and patient demographics to refine signal detection
  • temporal disproportionality analysis to detect signals that only appear after long-term drug use
  • integration of real-world evidence from electronic health records to validate statistical signals
  • network analysis to identify complex drug-drug-event interaction signals
  • development of signal detection methods specifically for biologic drugs and gene therapies
  • ai-powered systems to automatically search medical literature for corroborating evidence for a new signal
  • quantum computing algorithms to screen for multi-drug interactions at unprecedented scale
  • a personalized signal detection system that alerts clinicians to potential ADRs based on their specific patient’s profile
  • usando natural language processing on social media to detect patient-reported signals before they appear in official databases
  • automated signal detection for dispositivo medico adverse events
Argomenti correlati: rilevamento del segnale, analisi di sproporzione, rapporto di segnalazione proporzionale, PRR, rapporto di probabilità di segnalazione, ROR, data mining, farmacovigilanza, VigiBase, farmacoepidemiologia.

Contesto storico

Signal Detection using Disproportionality Analysis

1980
1980
1986-01-01
1990
1990
1993
1998
1980
1980
1982-07-01
1988-06-01
1990
1993
1997-04-23
2001

(se la data è sconosciuta o non rilevante, ad esempio "meccanica dei fluidi", viene fornita una stima approssimativa della sua notevole comparsa)

decimo anno anniversario

Le immagini a grandezza naturale e i download sono disponibili, gratuitamente al 100%, solo per gli utenti registrati.

> Login <