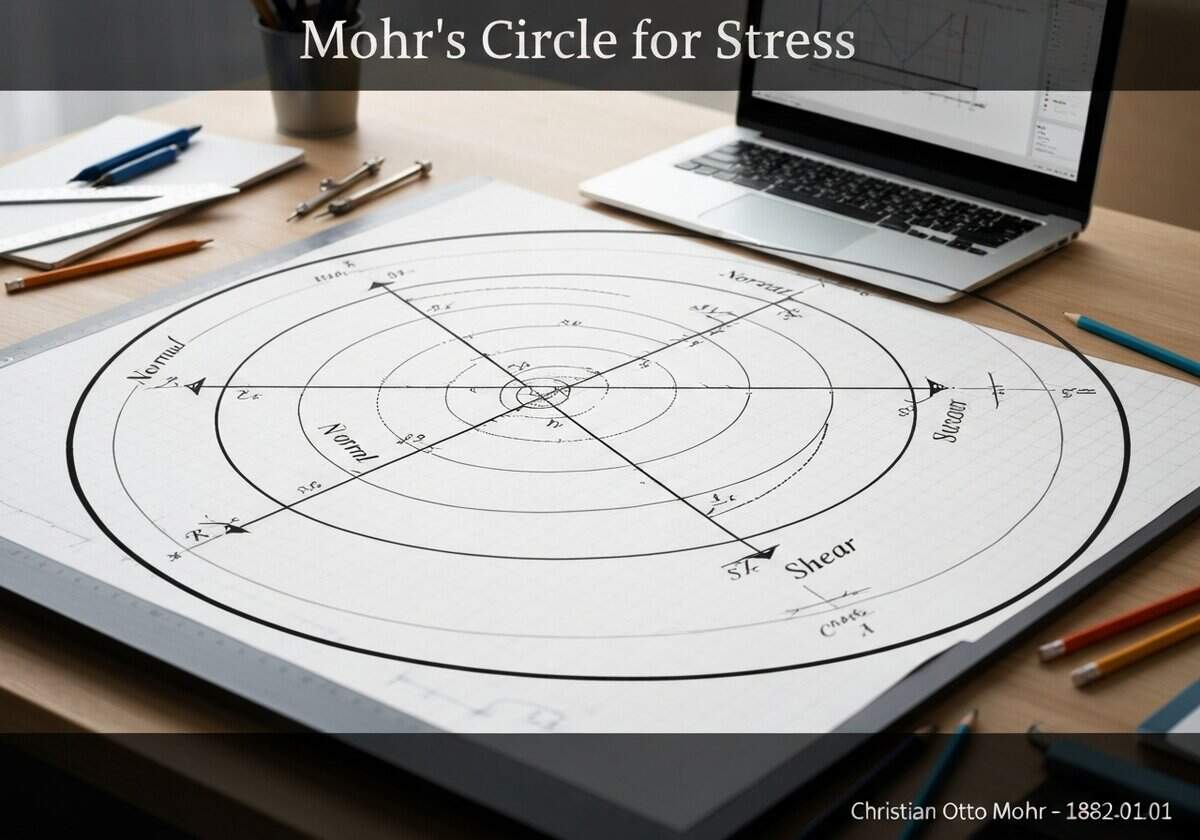
Mohr’s circle provides a powerful graphical tool to understand the state of stress at a point within a continuous body. For any given 2D stress state defined by normal stresses [latex]\sigma_x[/latex], [latex]\sigma_y[/latex] and 剪应力 [latex]\tau_{xy}[/latex], the circle allows one to find the stresses on any plane passing through that point. The center of the circle is located on the [latex]\sigma_n[/latex] axis at [latex]C = (\sigma_{avg}, 0)[/latex], where [latex]\sigma_{avg} = (\sigma_x + \sigma_y)/2[/latex]. The radius of the circle is calculated as [latex]R = \sqrt{\left(\frac{\sigma_x – \sigma_y}{2}\right)^2 + \tau_{xy}^2}[/latex]. Each point on the circumference of the circle represents the stress state ([latex]\sigma_n, \tau_n[/latex]) on a specific plane. A rotation of an angle [latex]\theta[/latex] of the physical plane corresponds to a rotation of [latex]2\theta[/latex] on Mohr’s circle in the same direction. This graphical method elegantly bypasses the need to solve the stress transformation equations directly for each angle, making it an intuitive and efficient method for engineers and physicists.