Explained Visually compared with 3Blue1Brown, Khan Academy and Brilliant| Explained Visually | 3Blue1Brown | Khan Academy | Brilliant |
|---|
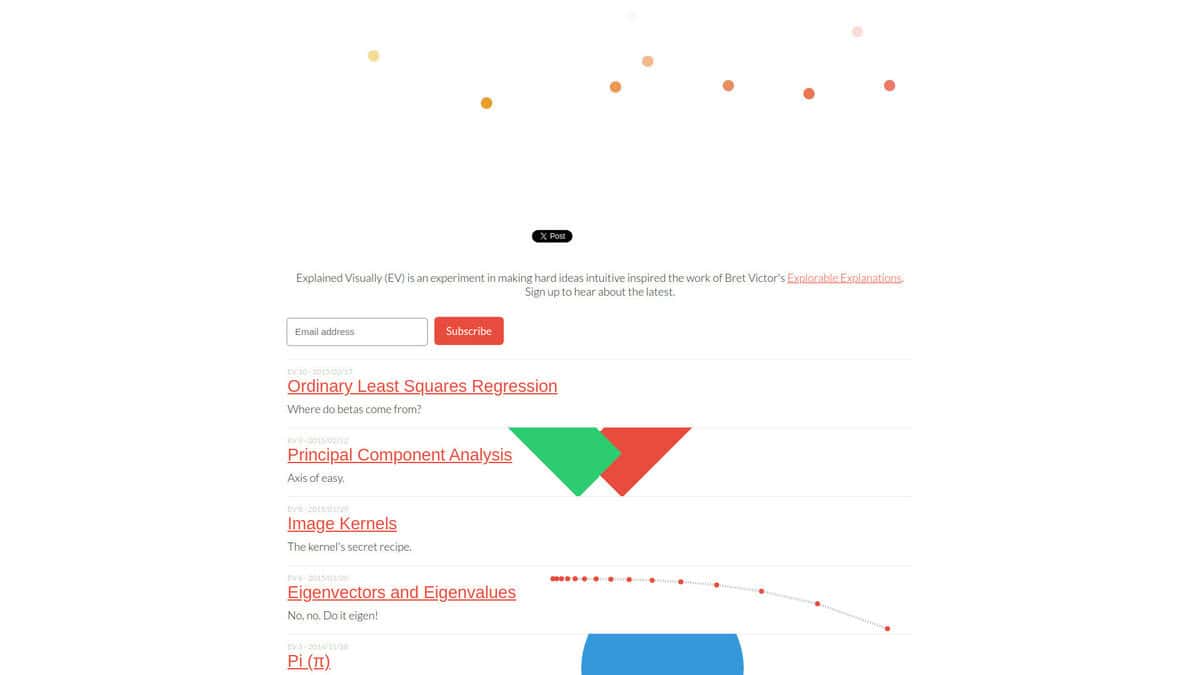
| Topics and scope: The site is a small set of interactive pages on single ideas: conditional probability, Markov chains, exponentiation, sine and cosine, pi, eigenvectors and eigenvalues, image kernels, principal component analysis and ordinary least squares regression. It is not organised as a course. | Topics and scope: The project is mainly a YouTube channel on linear algebra, calculus, neural networks and topology. Some lessons cover foundations for STEM undergraduates and others are explorations of puzzles. | Topics and scope: The science courses listed cover chemistry and physics at middle school, high school and Advanced Placement level, among other subjects. | Topics and scope: Courses run from arithmetic to college-level mathematics, plus Python coding, data science, science, technology and AI. Learning Paths group related courses into sequences. |
| Interaction and format: The pages are an experiment in making hard ideas intuitive, inspired by the Explorable Explanations work of Bret Victor. | Interaction and format: Videos are the main format, and the website adds written and interactive versions of many of them. | Interaction and format: Content consists of videos, articles and practice questions. | Interaction and format: Learners solve hands-on problems with visual models and get immediate feedback. A digital tutor called Koji gives step-by-step guidance without simply revealing answers. |
| Authorship and tools: The pages are a setosa.io project, and Victor Powell and Lewis Lehe are credited with the series of statistical graphics. | Authorship and tools: The author is Grant Sanderson. Almost all animations are made with Manim, a custom open-source Python library, and a community edition is recommended for new users. | Authorship and tools: The material is produced by a non-profit organisation. | Authorship and tools: Courses are produced by the company itself and delivered on web, iOS and Android, with progress synced across devices. |
| Cost model: The site links to a Patreon page and a merchandise store and thanks supporters and sponsors. The licensing FAQ on the site does not give its answer in the text reviewed. | Cost model: Learning is always free, funded by donations and grants. | Cost model: A free tier has daily limits and advertisements. Brilliant Premium is a paid subscription that removes those limits, and a free K-5 arithmetic practice library needs no account. |