Product Design, Manufacturing & Innovation Resources
Home » Online Tools » Cloudflare Radar

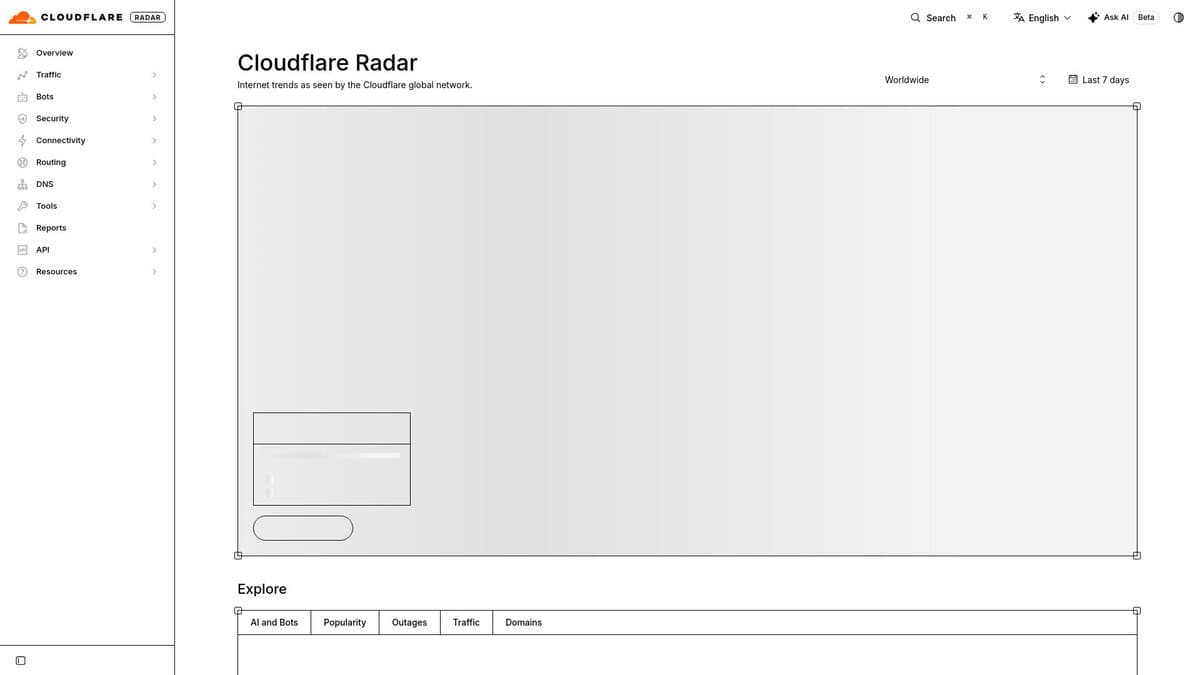
Cloudflare Radar

Cloudflare Radar publishes aggregated data from its own Cloudflare’s network, which handles a large share of global web traffic and DNS queries through 1.1.1.1. The data covers HTTP and DNS traffic volumes by country and network (ASN), with human versus bot share, device type, browser, OS, HTTP version (including HTTP/3), TLS version and post-quantum adoption, and IPv4 versus IPv6. It also covers verified bots and AI crawlers, including crawl-to-referral ratios per AI operator, as well as internet outages, BGP route leaks and hijacks, DDoS attack trends at layers 3, 4 and 7, email security (spam, DKIM, SPF, DMARC adoption), domain popularity rankings, and Internet Quality measurements (speed and latency by region).

Tip: two tools sit alongside the dashboards: a URL scanner that renders and reports on a page, and a bot directory describing known crawlers. Everything is available through a public API and downloadable datasets, with a free tier under a non-commercial license.

In engineering work, Radar answers questions that your own logs cannot. For incident triage, the Outage Center and per-ASN traffic let you check whether a drop in requests comes from your stack or from a regional network failure or a BGP event. For protocol and infrastructure decisions, adoption curves show whether HTTP/3, TLS 1.3, IPv6 or post-quantum key exchange has reached the share of clients that justifies the work. For bot policy, the AI crawler data and the bot directory let you compare your own log findings with global patterns and decide what to allow, rate-limit or block in robots.txt and WAF rules. Security and platform teams can use the DDoS, routing and email-authentication data as baselines for alerting thresholds and capacity planning. The API also allows scheduled queries that feed dashboards, so your internal metrics can be compared with the network-wide numbers.

Radar is a quick way to see whether a problem is local or a wider network incident. The data is free to browse without an account, and an API is available with a free token.

Nota: figures reflect traffic seen by Cloudflare, so they are a sample of the internet (but huge) and not a complete census.

Disciplines: Network engineering, Cybersecurity, Telecommunications, Web performance, Journalism.
Free alternative to Akamai State of the Internet, ThousandEyes.
Cloudflare Radar compared with Akamai State of the Internet and ThousandEyes
Cloudflare RadarAkamai State of the InternetThousandEyes (Internet Outages Map and Internet Insights)
Data origin: Radar uses aggregated and anonymized data from the Cloudflare global network and from its 1.1.1.1 public DNS resolver. The Investigate section mentions NetFlows, HTTP requests and DNS queries.Data origin: The reports are written by the Akamai Security Intelligence Group and draw on its own research and telemetry.Data origin: Data comes from thousands of vantage points where ThousandEyes agents run billions of measurements daily. These are active measurements, which differ from traffic logs collected at a CDN.
Topics covered: Sections cover traffic and adoption, bots and AI insights, application and network layer attacks, email security, post-quantum encryption, certificate and key transparency, Internet quality, outages, routing (including RPKI and anomalies) and DNS.Topics covered: Reports address application and API security, ransomware, DDoS, industry specific threats (financial services, healthcare, retail), fraud and abuse, AI related risks and year in review summaries. Routing and adoption statistics are not the focus.Topics covered: The public map shows ongoing and recent outages of application providers (SaaS) and network providers (ISPs, cloud networks, CDN and DNS services), with provider, location, duration and scale.
Access and licence: The Radar API is described as free, and its data is licensed under CC BY-NC 4.0, so commercial reuse needs a separate agreement. The site also offers a Data Explorer, a URL Scanner and a Network Quality Test.Access and licence: Reports are offered as downloads, infographics and charts and data files. The page does not state whether registration is needed or what reuse terms apply.Access and licence: The outage map is public. Root causes, network impact on applications and automatic alerts require the paid Internet Insights subscription, for which a free trial is offered.
Time resolution and limits: Figures reflect the traffic that Cloudflare observes, so they describe a very large sample and not a census of the internet.Time resolution and limits: The page gives no publication schedule, and items are labeled by year. The reports suit trend analysis and benchmarking more than incident response.Time resolution and limits: The map refreshes every 5 minutes. Outages shorter than five minutes are not shown, and application outages must involve at least five servers. Slowness or login failures are not reported as outages, and dots mark server locations, not affected users.
Typical use: Radar helps decide whether a traffic drop or error rise comes from your own stack or from a regional network event, and it offers adoption data for protocol decisions.Typical use: The reports give security teams attack trend context by region and industry for threat modelling and reporting.Typical use: It targets network operations and IT teams that depend on internet reachable services, with dashboards on provider availability and outage scope.

More Live Monitoring & Tracking, OSINT tools

Suggest your best online tool:

Do you know a better, a complementary or a replacement website to the one listed above ?

> Suggest it here <

10th year anniversary

Full size images and downloads are only available, 100% free, for registered members.

> Login <