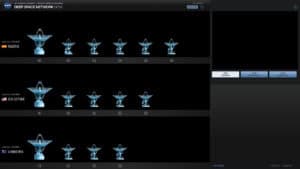
DSN Now
DSN Now is the NASA JPL live display of the Deep Space Network, the antenna complexes at Goldstone in California,
DSN Now is the NASA JPL live display of the Deep Space Network, the antenna complexes at Goldstone in California,
Blitzortung is a community operated lightning detection network that shows lightning strikes on a live map. The map displays strikes

Windy is a visualization platform for weather data, showing wind, gusts, temperature, pressure, precipitation, clouds, waves and many other layers
Cloudflare Radar publishes aggregated data from its own Cloudflare’s network, which handles a large share of global web traffic and

FIRMS, the Fire Information for Resource Management System, maps active fire and thermal anomaly detections from satellites. The web map
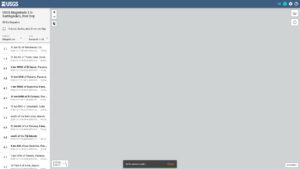
The USGS Latest Earthquakes map shows earthquakes recorded worldwide, with the most recent events on top. The map can be

Electricity Maps shows the real time electricity mix and carbon intensity of power grids around the world. For each zone,
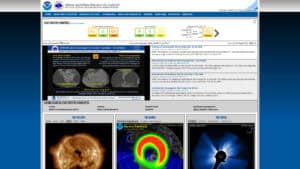
The Space Weather Prediction Center is the official US source for space weather observations, forecasts and alerts. The site shows
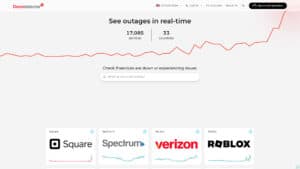
Downdetector tracks outages of online services in real time from user reports. Each service has a page with a chart

NetBlocks is a global internet monitor and watchdog that provides real-time measurement and analysis of internet connectivity, cybersecurity, and digital