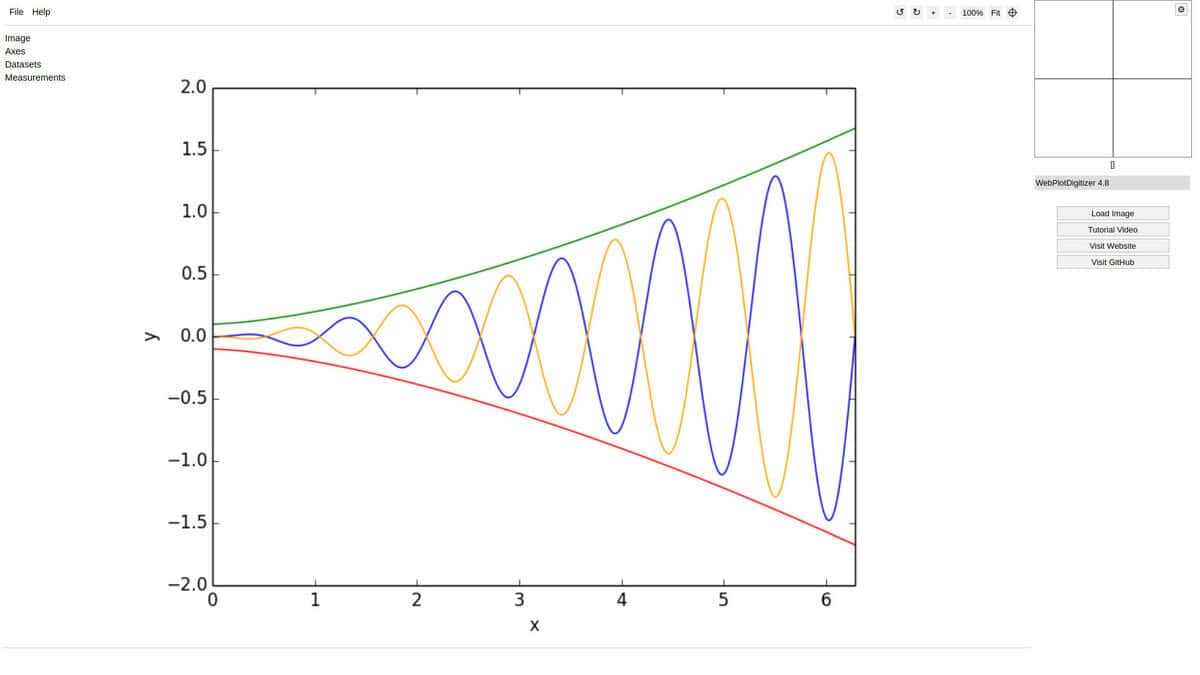
WebPlotDigitizer compared with Engauge Digitizer, GetData Graph Digitizer and DigitizeIt| WebPlotDigitizer | Engauge Digitizer | GetData Graph Digitizer | DigitizeIt |
|---|
| Main technical fields: Scientific research, data analysis, engineering, medicine and patent analysis, mainly to recover values from older papers whose raw data were never published and to digitize datasheet curves, pump curves or published test charts for reuse in a model. | Main technical fields: Engineering and academic research, with its own documentation citing the recovery of numbers from decades-old engineering documents for safety analyses and of historical chart data for theses. | Main technical fields: General scientific and technical use, and its DXF and EPS exports point to drawing and publishing workflows. | Main technical fields: Scientific publications, since its stated purpose is to recover data values from a plot when a paper publishes only the figure. |
| Typical expertise required: Entry level, with no programming or installation, as the user only has to recognize the axis type and scale of the figure, such as log, date or polar, to calibrate correctly. | Typical expertise required: Entry to intermediate, as the user installs the program, sets three axis points, then places points along each curve, with a manual and tutorial available. | Typical expertise required: Entry level for XY graphs, as the user sets the axis ranges and scales manually and can set background and curve colors to separate several data series. | Typical expertise required: Entry level, with a three-step process that needs no scripting and no more knowledge than the axes of the figure. |
| Source documents and plot types: It handles XY, bar, polar and ternary plots, maps with a scale bar and circular chart recorders, with log and date axes, which covers most datasheet, paper and instrument chart formats. | Source documents and plot types: It takes an image file of a graph or a map coming from a scanner, a digital camera or a screenshot. | Source documents and plot types: It reads TIFF, JPEG, BMP and PCX images and is intended for standard XY graphs. | Source documents and plot types: It takes a graph imported from a file or from the clipboard and is oriented to XY graphs. |
| Calibration and extraction: You calibrate the axes by clicking known points, then mark points by hand or let automatic extraction detect curves and bars, and the same tool measures distances, angles and areas. | Calibration and extraction: After three axis points are set, it traces line plots automatically, which speeds up the extraction of continuous curves. | Calibration and extraction: It offers automatic line tracing, digitizing of a whole area and point snapping, plus editing tools to reorder or delete extracted points. | Calibration and extraction: You define the axes system, then digitize automatically or manually. |
| Output and reuse: Acquired data can be exported, and the session is saved as a JSON or project file, so a colleague can reopen and check the extraction. | Output and reuse: Numbers are read on screen and copied into a spreadsheet such as Excel or Gnumeric. | Output and reuse: It exports TXT, XLS, XML, DXF and EPS files, and DXF is the format to pick when a curve must go straight into a CAD drawing. | Output and reuse: Values are saved in ASCII format or pasted directly into another application such as Excel. |
| IT, licence and cost constraints: It runs in the browser with no installation and no login, is open source under the AGPL license and free, so it works on a company computer where installing software is restricted. | IT, licence and cost constraints: It must be installed on Windows, macOS or Linux, and it is free and open source, so the only barrier is the company policy on installing open source software. | IT, licence and cost constraints: It is Windows-only paid shareware with a trial period and personal licences, so each user needs a purchase. | IT, licence and cost constraints: It must be installed on Windows, macOS or Linux and is bought once as a perpetual license, so each user needs a purchase. |
| When to choose it: For a one-off figure from a paper or datasheet, for polar, ternary or bar plots, or when nothing can be installed. | When to choose it: For free offline digitizing of line curves on a workstation where open source software is allowed. | When to choose it: For Windows users who need DXF or Excel files and accept a small license fee. | When to choose it: For users who want an offline desktop program with a simple workflow and are ready to pay once. |