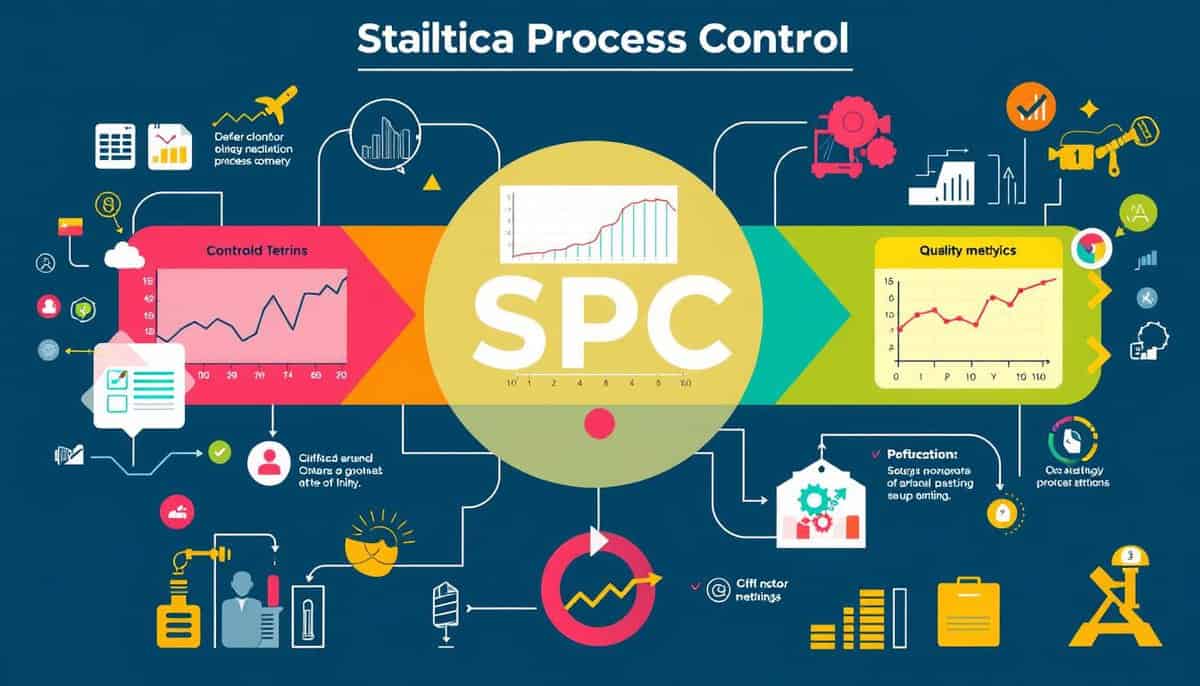
통계적 공정 관리(SPC)는 품질 관리의 핵심입니다. SPC는 실시간 정보를 제공하여 품질 관리를 지원합니다. 프로세스 성능 and product quality high. This method is essential in manufacturing for tracking processes and cutting unwanted variations.
SPC(통계적 공정 관리)는 기업이 프로세스를 개선하고, 결함을 줄이며, 생산성을 향상시키는 데 도움을 줍니다. 통계 도구를 통해 기업은 다양한 변화 원인을 파악하고, 문제를 신속하게 해결하여 높은 품질을 유지할 수 있습니다.
핵심 요약
- SPC는 제조 과정에서 발생하는 변동의 일반적인 원인과 특수한 원인을 파악하는 데 도움이 됩니다.
- 통계적 공정 관리(SPC)에서 공정 개선을 위해서는 관리도를 효과적으로 활용하는 것이 매우 중요합니다.
- SPC의 역사적 발전은 1920년대 월터 A. 셰워트의 연구로 거슬러 올라갑니다.
- 최적의 샘플 크기와 적절한 데이터 수집은 정확한 SPC 분석에 필수적입니다.
- Real-time monitoring and analysis facilitate maintaining high-quality standards.
통계적 공정 관리(SPC)의 기본 원리 이해하기
통계적 공정 관리(SPC)는 오늘날 제조업을 비롯한 여러 산업 분야에서 매우 중요한 기술입니다. SPC는 통계적 분석을 활용하여 공정을 면밀히 관찰하고 고품질 결과를 달성하는 것을 목표로 합니다. SPC를 통해 제품의 일관성이 향상되고, 불량률이 감소하며, 운영이 더욱 원활해집니다.
정의 및 중요성
미국품질협회(ASQ)는 통계적 공정 관리(SPC)를 "공정 관리를 위해 통계를 활용하는 것"이라고 정의합니다. SPC는 공정 변동의 원인을 파악하고, 이러한 문제를 해결하여 제품 품질을 향상시키고 낭비를 줄이는 데 도움을 줍니다. 예를 들어, 한 자동차 공장은 SPC를 도입하여 단 6개월 만에 불량률을 37% 감소시켰습니다. 또한, 한 전자제품 제조업체는 생산량을 22% 증대시켰습니다.
역사적 배경
통계적 공정 관리(SPC)는 1920년대 벨 연구소의 월터 셰워트 박사에 의해 시작되었습니다. 셰워트 박사의 공정 변화 측정에 대한 아이디어는 획기적이었습니다. 이후 일본의 W. 에드워즈 데밍 덕분에 SPC는 크게 발전했습니다. 시간이 흐르면서 SPC는 전 세계 품질 관리의 핵심 요소가 되었습니다.
핵심 원칙
SPC를 올바르게 사용하려면 기본 사항을 숙지하는 것이 매우 중요합니다. 핵심 내용은 다음과 같습니다.
- 공정 변동 분석: 정상적인 공정 변동과 문제가 있음을 나타내는 변동을 구분하는 것.
- 공정 안정성: 지속적인 점검과 조정을 통해 안정적인 성능을 유지합니다.
- 지속적인 개선: 항상 데이터를 활용하여 더 나은 방식으로, 더 높은 품질로 일을 처리하는 방법을 찾습니다.
이러한 아이디어 덕분에 SPC는 높은 품질을 유지하는 데 탁월합니다. medical device SPC 도입으로 고객 불만 건수가 45% 감소했으며, 포장 업계는 연간 120만 달러를 절감했습니다.
실현된 이점
| 산업 | SPC 구현 결과 |
|---|---|
| 자동차 | 불량률 37% 감소 |
| 전자제품 | 처리량 22% 증가 |
| 의료기기 | 고객 불만 건수 45% 감소 |
| 포장 | 연간 120만 달러 절감 |
| 정밀 가공 | 규격 미달 부품 62% 감소 |
| 병원 응급실 | 평균 대기 시간 28% 감소 |
| 반도체 | 수확량 18% 향상 |
통계적 공정 관리(SPC)에서 관리도의 역할
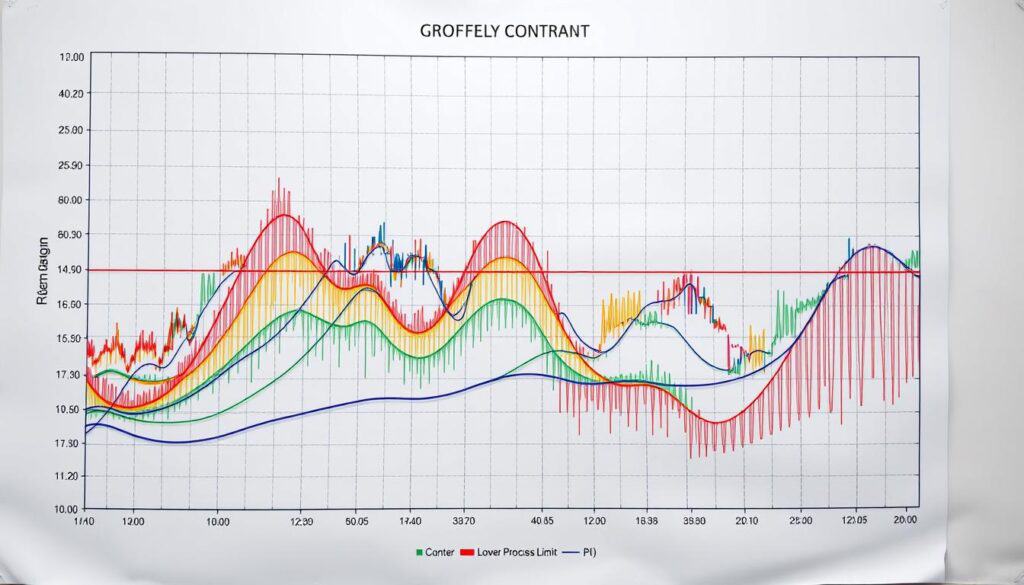
관리도는 통계적 공정 관리(SPC)에서 핵심적인 역할을 합니다. 관리도는 시간에 따른 데이터를 보여주어 정상적인 변화와 비정상적인 변화를 구분하는 데 도움을 줍니다. 또한 공정의 진행 상황을 추적하여 제품 품질 관리에 필수적인 요소입니다.
관리도의 종류
다른 관리도 특정 데이터 유형 및 용도에 맞게 제작되었습니다.
- X-bar 및 범위 차트하위 그룹 크기가 2~10일 때 가장 효과적입니다. 하위 그룹 평균의 관리 한계 내에서의 안정성을 확인합니다. 이 관리 한계는 평균에서 3표준편차로 설정됩니다.
- X-bar 및 시그마 차트: 더 큰 하위 그룹에 적합합니다. 프로세스가 어떻게 변하는지 더 잘 파악할 수 있게 해줍니다.
- 개별 X 및 이동 범위(IX-MR) 차트하위 그룹에 항목이 하나만 있는 경우에 적합합니다. 예를 들어 각 측정값을 개별적으로 관찰할 때 유용합니다.
- 구역표X-bar 차트와 CUSUM 차트의 특징을 결합한 형태입니다. 데이터 포인트는 편차 영역에 표시되어 문제를 강조합니다.
- 누적합(CUSUM) 차트평균값의 변화를 확인하는 데 아주 유용합니다. 이는 시간에 따른 편차를 합산하여 계산합니다.
- 히스토그램이러한 도표 샘플은 데이터 패턴이 얼마나 자주 발생하는지 연구하는 데 사용됩니다.
관리도 해석하기
관리도를 이해하면 변동 원인을 파악하고 신속하게 문제를 해결할 수 있습니다. 관리 한계는 일반적으로 평균에서 3표준편차만큼 떨어진 값입니다. 이를 통해 정상적인 변화와 비정상적인 변화를 구분할 수 있습니다. Western Electric Rules는 문제 발견을 위한 지침을 제공합니다. 예를 들어, 3시그마 한계를 벗어난 데이터 포인트나 관리선 근처에 여러 개의 포인트가 있는 경우 문제가 있음을 나타냅니다.
다양한 산업 분야에서의 응용
관리도는 단순히 제품 제조뿐만 아니라 다양한 분야에서 중요합니다. 의료 분야에서는 관리도를 통해 진료 과정을 점검하고 높은 수준의 의료 서비스를 유지할 수 있습니다. 예를 들어, 투약 시간을 추적하여 장비 문제나 인력 부족과 같은 문제를 조기에 발견할 수 있습니다. 금융 분야에서는 관리도를 활용하여 거래상의 이상 징후를 파악하고 부정행위를 방지할 수 있습니다.
SPC에서 관리도를 사용하면 기업은 실시간으로 상황을 관찰하고 분석할 수 있습니다. 이는 프로세스를 개선하고 높은 품질 기준을 유지하는 데 핵심적인 요소입니다.
Steps to Implement SPC in Your Organization

Putting SPC to work in your organization involves careful steps. These ensure your efforts in SPC really pay off, boosting quality and work. It’s about making things better and more efficient over time.
Establishing Measurement Methods
First, you need strong measurement methods. Getting accurate, consistent data is key. It helps analyze things correctly. Use tools like cause and effect diagrams and histograms to spot and rank issues. This helps managers understand problems and act rightly.
Qualifying the Measurement System
It’s crucial to check that your measurements are spot on. This is done by analyzing your measurement system. A common way is gauge R&R (Repeatability and Reproducibility). This step confirms if your data’s trusty, useful for creating precise SPC charts.
Data Collection and Charting
Collecting data should be orderly, hitting all parts of the process. Then, data go on SPC charts to keep an eye on how the process behaves. Charts like moving ranges and x & R help show variation and signal when things aren’t right. Gathering data and charting it helps in bettering the process and predicting outcomes.
Developing a Reaction Plan
Making a ready-to-act plan based on SPC findings helps with quick decisions. This plan lists steps for when things don’t go as planned. Fixing issues often needs teamwork, as Dr. W.E. Deming pointed out with 94% of problems needing joint efforts. A solid plan keeps everything under control and improvements ongoing.
| Action Step | 설명 | 이익 |
|---|---|---|
| Establishing Measurement Methods | Utilizing tools like histograms and Pareto charts to prioritize problems. | Improved understanding of variations and accurate data. |
| Qualifying the Measurement System | Conducting measurement system analysis to ensure data reliability. | Accurate and reliable data collection. |
| Data Collection and Charting | Systematically collecting data and using SPC charts. | Effective monitoring and prediction of process outcomes. |
| Developing a Reaction Plan | Creating a plan for timely interventions based on SPC analysis. | Enhanced control and sustained improvements. |
Stepping through SPC with these planned actions helps build a continuous improvement culture. It brings together workers and managers, pushing for lasting wins in quality work. It’s all about teamwork and keeping up the good work.
Common Pitfalls and How to Overcome Them
Starting Statistical Process Control (SPC) can bring big rewards. Yet, many groups hit snags that hold them back. Knowing and fixing these troubles is key to making processes better and improving quality control.

Some think SPC doesn’t fit certain industries with frequent changes and short production times. It’s important to know SPC can still help if you tailor it right. There’s also a wrong belief that SPC will cut out variation all on its own, without tackling the main reasons for the variation.
For SPC to work well, data must be right. Mistakes in data or doing things by hand can cause errors. Using tech to gather data helps avoid mistakes and allows for quick data checks. This leads to better choices. Setting clear data rules boosts process improvement methods.
Knowing the difference between managing products and processes is crucial. Mixing up control limits (process voice) with specification limits (customer voice) often causes wrong actions. Also, creating control limits based on guesses, not stats, leads to wrong numbers.
Resistance to change can also block SPC’s way. Workers might see SPC as more work or think it lessens their skills. Clear talks on SPC’s perks and full training can tackle this problem.
Management’s backing is vital for SPC’s win. Without leaders’ help, workers might not get what they need to do well. Regular checks and always training can fix this.
To wrap up, beating SPC hurdles needs a grasp of its details, right data use, open talks, and strong management backing. With these steps, groups can greatly improve processes and their quality control work.
Advantages of Statistical Process Control
Statistical Process Control (SPC) boosts operations and product quality for manufacturers. It’s great at reducing process variability. This makes outputs more consistent. Using SPC control charts, companies monitor quality and spot variations quickly. They adjust on-the-fly to avoid defects. This keeps processes and products uniform.
SPC also leads to increased productivity. It identifies defects early, so only targeted fixes are needed, not full shutdowns. This saves time and uses resources well, boosting productivity. Plus, SPC software reduces manual checks. It spots errors early, making equipment adjustments quick for smooth production.
SPC also boosts improved customer satisfaction. Quality consistency means fewer defects and more reliability. Customers get what they expect, building their trust. SPC software’s data analysis helps companies meet industry standards. This improves their quality 평판. By using SPC well, businesses streamline their operations, cut costs, and stay ahead in the market.
관련 참고 문헌 및 방법
- 전사적 품질 관리 (TQM): focuses on continuous improvement and customer satisfaction through systematic process improvements.
- 실험 계획(DOE): a statistical method to plan, conduct, and analyze controlled tests to evaluate the factors that influence process outcomes.
- 적시 생산 (JIT) 생산: a strategy to increase efficiency and reduce waste by receiving goods only as they are needed in the production process.
- Process mapping: visual representation of a process to identify areas for improvement and streamline workflow.
자주 묻는 질문
통계적 공정 관리(SPC)란 무엇인가요?
SPC는 제품 품질을 향상시키는 방법입니다. 통계를 활용하여 공정의 일관성을 모니터링하고 개선합니다. 이 방법은 생산 품질을 실시간으로 점검합니다.
SPC는 품질 관리에서 왜 중요한가요?
SPC는 다양한 분야에서 엄격한 품질 관리를 유지하는 데 핵심적인 역할을 합니다. SPC는 공정상의 정상적인 변화를 파악하는 데 도움을 주어 안정적인 공정과 더 나은 제품을 만들어내고 운영 효율성을 향상시킵니다.
SPC에서 관리도란 무엇인가요?
관리도는 SPC의 핵심 도구입니다. 관리도는 시간에 따른 공정 데이터를 보여주며 정상적인 변화와 비정상적인 변화를 명확히 보여줍니다. X-bar 차트, R 차트 등 다양한 데이터 요구 사항에 맞는 여러 종류의 관리도가 있습니다.
관리도는 공정 변동 분석에 어떻게 도움이 되나요?
관리도는 비정상적인 변동 사항을 보여줌으로써 문제를 조기에 발견할 수 있도록 도와줍니다. 이를 통해 신속한 수정이 가능해지고, 공정의 안정성을 유지하고 품질을 향상시키는 것이 더욱 쉬워집니다.
조직에서 SPC를 구현하는 단계는 무엇입니까?
SPC를 시작하려면 기업은 효과적인 측정 방법을 갖추고 이를 정확하게 평가해야 합니다. 체계적으로 데이터를 수집하고 SPC 차트를 효과적으로 활용해야 하며, SPC 결과를 바탕으로 한 탄탄한 실행 계획은 시의적절한 조치를 위해 필수적입니다.
SPC 구현 시 흔히 발생하는 어려움은 무엇이며, 어떻게 극복할 수 있을까요?
문제점으로는 데이터 오해와 장비 교정 불량 등이 있습니다. 또한 새로운 방법에 대한 반발도 흔히 발생합니다. 이러한 문제를 해결하려면 종합적인 교육, 빈번한 시스템 점검, 그리고 SPC의 이점에 대한 명확한 소통이 필요합니다.
제조 공정에 SPC를 적용하면 어떤 이점이 있습니까?
제조 과정에서 SPC(통계적 공정 관리)를 활용하면 공정 변동성을 줄이고 생산성을 향상시킬 수 있습니다. 또한 비용을 절감하고 고객 만족도를 높일 수 있습니다. 기업은 품질 향상을 위해 선제적으로 조정할 수 있으므로 경쟁 우위를 확보할 수 있습니다.
SPC는 제조업 이외의 산업에서 공정 개선에 어떻게 기여할까요?
SPC는 제조업에만 국한되지 않습니다. 데이터, 안정성, 지속적인 개선에 중점을 두는 SPC는 의료 및 금융 분야에서도 효과적입니다. 다양한 산업 분야에서 품질 관리 및 프로세스 개선을 촉진합니다.
품질 관리를 위한 통계적 공정 관리 관련 외부 링크
(링크 위에 마우스를 올려놓으면 콘텐츠에 대한 설명을 볼 수 있습니다.)
사용된 용어집
Cumulative Sum (CUSUM): 목표값으로부터의 편차 누적 합계를 계산하여 프로세스의 변화를 모니터링하는 데 사용되는 통계적 방법으로, 시간 경과에 따른 평균값의 변화를 감지할 수 있습니다.
Design of Experiments (DOE): 여러 변수가 반응 변수에 미치는 영향을 평가하기 위해 통제된 시험을 계획, 수행, 분석 및 해석하는 체계적인 방법으로, 공정이나 제품을 최적화하고 이해할 수 있도록 해준다.
Design of Experiment (DOE): a systematic method for planning, conducting, and analyzing controlled tests to evaluate the effects of multiple variables on a response variable, facilitating the identification of optimal conditions and interactions among factors.
Just In Time (JIT): 제조 공정에서 필요할 때만 자재를 공급받아 재고 비용을 절감하고, 낭비를 최소화하며 효율성을 높이는 생산 전략.
Just-In-Time (JIT): 제조 공정에서 필요한 시점에 정확하게 자재와 부품이 도착하도록 일정을 계획함으로써 재고 비용을 절감하고, 낭비를 최소화하며 효율성을 높이는 생산 전략.
Measurement System Analysis (MSA): a statistical method used to evaluate the accuracy, precision, and reliability of measurement processes and instruments, ensuring that data collected is valid and consistent for decision-making in quality control and process improvement.
Repeatability and Reproducibility (R&R): a measurement system's ability to produce consistent results under the same conditions (repeatability) and across different conditions or operators (reproducibility), often evaluated through statistical methods to assess variability and reliability in data collection processes.
Statistical Process Control (SPC): a method of quality control that employs statistical techniques to monitor and control a process, ensuring it operates at its full potential by identifying variations and maintaining consistent output within specified limits.
Total quality management (TQM): 고객 만족을 통한 장기적인 성공에 초점을 맞춘 경영 접근 방식으로, 조직의 모든 구성원이 프로세스, 제품 및 서비스의 지속적인 개선에 참여하여 품질과 성과를 향상시키는 것을 목표로 합니다.