Product Design, Manufacturing & Innovation Resources
Home » Lean Sigma Green Belt

Lean Sigma Green Belt - Course & Test

Lean Sigma Green Belt

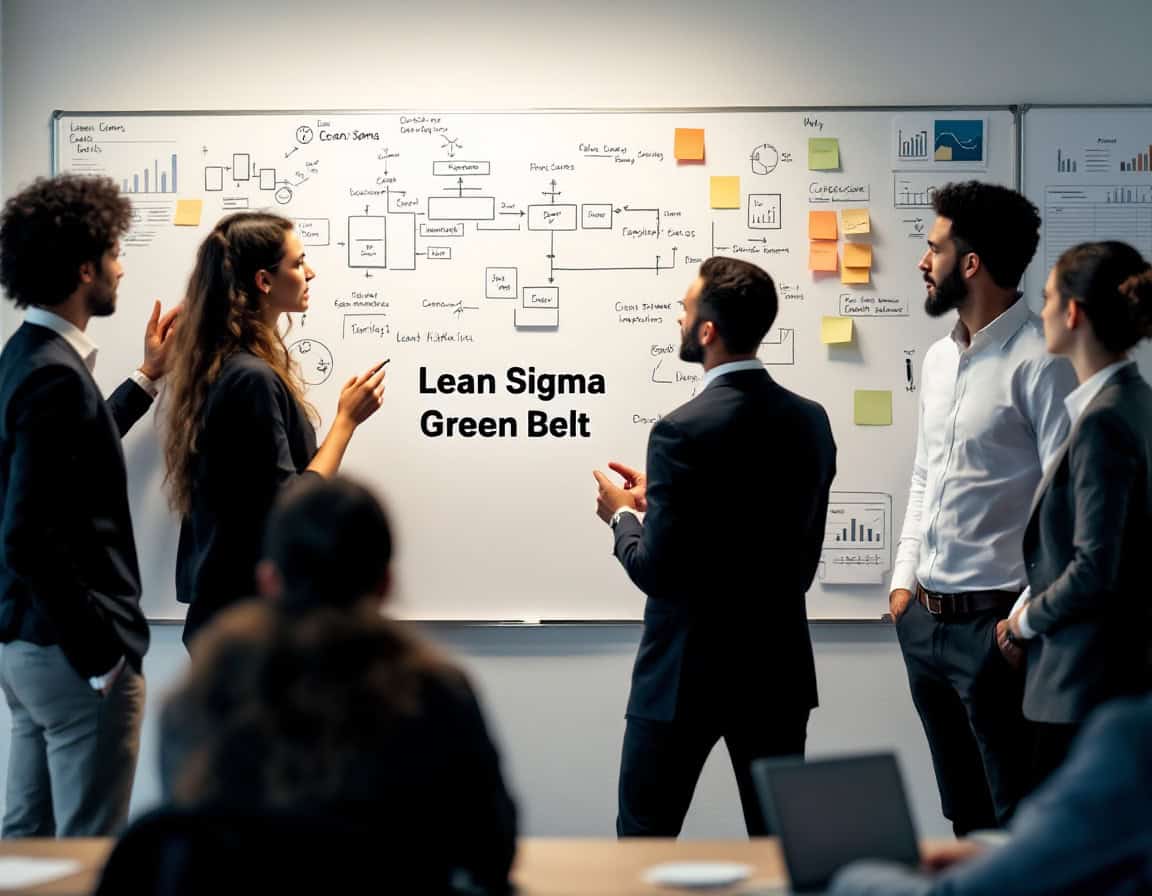
In the Lean Sigma belts methodology, the Green Belt sits between the two-day floor-level literacy of Yellow Belt and the full-time statistical practice of the Black Belt: someone who runs improvement projects inside their own department while keeping their regular job, typically committing a quarter to half of their time to the work rather than all of it. Where Yellow Belt teaches recognition – naming waste, following 5S, contributing to a kaizen event someone else leads – Green Belt teaches execution: owning a DMAIC project start to finish, writing the charter, mapping the process, pulling the data, and defending root cause with something more rigorous than a hunch.

Green belt
Green belt certification in lean six sigma integrates operational execution with statistical analysis, bridging waste reduction and defect management.

The training adds the layer Yellow Belt deliberately skips: basic inferential statistics, process capability indices, measurement system analysis, FMEA scoring, control charts. A Green Belt doesn’t need to derive the mathematics behind a hypothesis test, but they need to run one correctly, read the output, and know when the result changes a decision.

Inside the belt hierarchy, Green sits as the operational core: Black Belts design methodology and coach across multiple projects, Master Black Belts set the program’s statistical and training standards, and Yellow Belts execute local fixes without carrying a project – Green Belts are the ones actually closing tickets on the DMAIC scoreboard, usually several a year, each with a dollar figure attached. That positioning shapes what the certification is for: it’s the level at which Lean Six Sigma stops being a vocabulary and becomes a job function, the point where a company gets a self-sufficient project owner instead of someone who merely understands the diagrams. Within the methodology itself, Green Belt is where Lean’s waste-and-flow thinking and Six Sigma’s variation-and-defect thinking actually fuse into one discipline rather than two adjacent ones – a Green Belt project routinely opens with a value stream map and closes with a control chart, using both toolkits on the same problem because separating them stopped being useful the moment the work got real.


The Concepts & Tools to Learn in this Course:

These are the bodies of knowledge that will be assessed in the test below:

  • Project charter: defines the problem statement, scope, goal and team roles before a DMAIC project starts
  • SIPOC diagram: frames suppliers, inputs, process, outputs and customers at a high level before detailed mapping
  • Voice of the Customer: converts complaints and requirements into measurable specification limits
  • Measurement System Analysis: checks whether the data collection method itself can be trusted before analyzing it
  • Gage R&R: separates measurement variation into the part, the operator and the gage itself
  • Data collection plan: fixes what to measure, how often, by whom and with which gage before gathering a single point
  • Central Limit Theorem: explains why sample averages settle into a predictable pattern even when raw data does not
  • Normality testing: checks whether a data set fits a bell curve before picking the right statistical test
  • Hypothesis testing: replaces a gut call with a p value when comparing two conditions
  • Two sample t test: checks whether the means of two small samples differ for a real reason
  • ANOVA: compares the means of three or more groups in a single test
  • Chi square test: checks whether categorical outcomes, such as defect type by shift, differ meaningfully
  • Correlation and simple regression: quantifies how strongly one variable predicts another
  • Process capability, Cp and Cpk: measures how well a process output fits inside its specification limits
  • Control charts, X bar R and I MR: tracks a process over time and flags a shift before it becomes a defect
  • Pareto analysis: ranks causes by frequency to spend effort on the few that drive most of the problem
  • Fishbone diagram: sorts candidate root causes into fixed categories such as machine, method, material and man
  • Multi vari study: splits variation into within part, between part and time to time sources before testing anything
  • FMEA risk scoring: ranks failure modes by severity, occurrence and detection to decide what to fix first
  • Statistical software practice: runs the tests and control charts in a tool such as Minitab instead of by hand
  • Piloting a solution: tests an improvement on a small scale and confirms the gain before rolling it out fully

Our Suggested Readings

The list below is a special selection of our original articles, tools and methodologies available on this site.

Tip: the big dot at the start of each title indicates if that post/article has already been read ( ● ), or not ( ○ ). Refresh the page if necessary.

Tip: the reading progress is recorded either in a cookie (if you are not logged in or no account created), or in your site profile. Use the later to be sure not to loose your progression.

As soon as you start a given article, your progress will be indicated on top of each page to help you finish and move on to the next.

Note: for this particular course, we recommend to read the articles in that order.

The Exam For This Course

After you are familiar with the lectures above, so as having done your own readings, we recommend attending the Exam below.

The test consists of 20 questions in random order, out of many more, to insure novelty each time. Each completely correct answer gets you 10 points. You get a full correction at the end of the test.

If the course has different levels, the current test does not include questions of lower levels, making it … hard that level!

  • radio-buttons: only 1 correct answer must be selected
  • check-boxes: 1 or several answers must be checked (with strict all-good-or-nothing grading logic)

Tip: mouse over “Hint” to get an advise for the response.

Only innovation.world members can see it below and attend it.

Exam version: 01.00.00

Related Posts

10th year anniversary

Full size images and downloads are only available, 100% free, for registered members.

> Login <