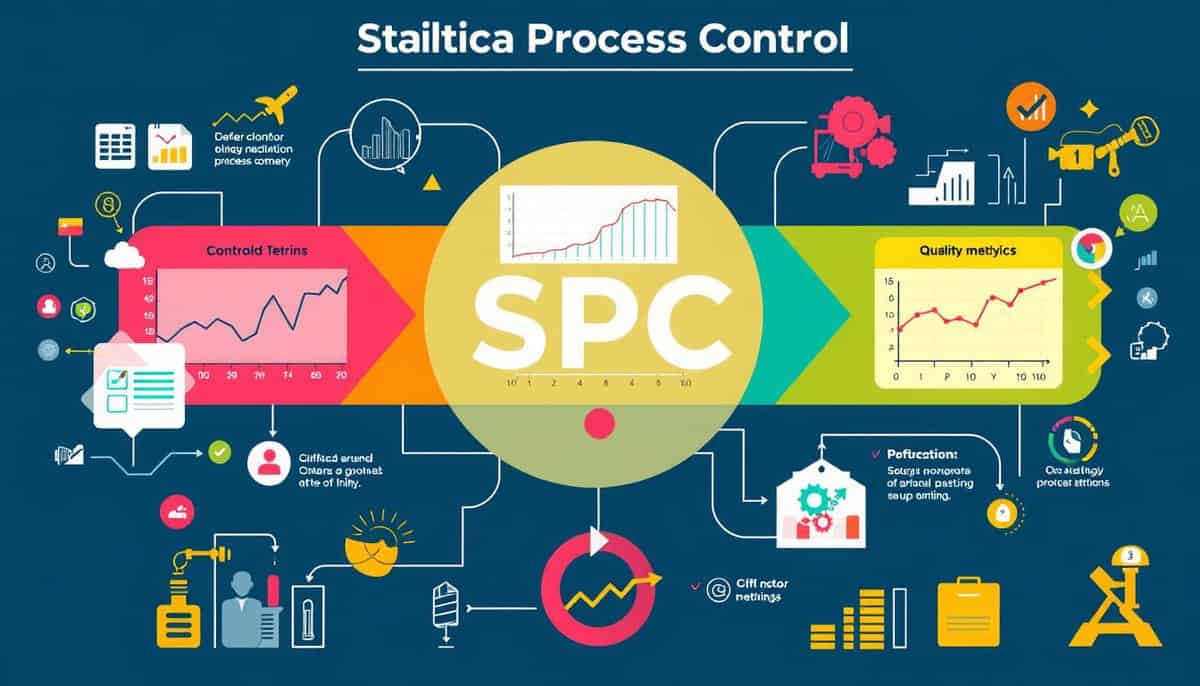
Statistical Process Control (SPC) is key in quality management. It gives real-time insights to keep process performance and product quality high. This method is essential in manufacturing for tracking processes and cutting unwanted variations.
SPC lets companies enhance their processes, cut defects, and boost productivity. Through statistical tools, organizations can spot various causes of changes. This allows them to fix problems fast and keep quality high.
Key Takeaways
- SPC helps in identifying common and special causes of variation in manufacturing.
- Effective use of control charts is crucial for process improvement in SPC.
- Historical development of SPC traces back to Walter A. Shewhart’s work in the 1920s.
- Optimal sample sizes and proper data collection are vital for accurate SPC analysis.
- Real-time monitoring and analysis facilitate maintaining high-quality standards.
Understanding the Basics of Statistical Process Control (SPC)
Statistical Process Control (SPC) is a crucial technique in today’s manufacturing and other industries. It uses statistical analysis to keep an eye on processes, aiming for high-quality results. Thanks to SPC, products become more consistent, defects drop, and operations run smoother.
Definition and Importance
The American Society for Quality (ASQ) calls Statistical Process Control “the use of statistics to manage a process.” SPC helps find out why processes vary. Then, it fixes these issues to keep product quality up and waste down. For example, an auto plant cut its defects by 37% in just six months with SPC. Also, an electronics maker boosted its production by 22%.
Historical Background
Statistical Process Control started in the 1920s with Dr. Walter Shewhart at Bell Laboratories. Dr. Shewhart’s ideas on measuring process changes were groundbreaking. Later, Japan improved SPC a lot, thanks to W. Edwards Deming. Over time, SPC has become key to quality control all over the world.
Core Principles
The basics of SPC are vital to use it right. Key parts include:
- Process variation analysis: telling the difference between normal process variations and ones that signal trouble.
- Process stability: keeping performance steady by always checking and tweaking.
- Continuous improvement: always using data to find ways to do things better and with higher quality.
These ideas make SPC great at keeping quality high. A medical device company saw a 45% lower rate of customer complaints with SPC. And, the packaging sector saved $1.2 million a year.
Benefits Realized
| Industry | SPC Implementation Outcome |
|---|---|
| Automotive | 37% reduction in defect rates |
| Electronics | 22% increase in throughput |
| Medical Device | 45% drop in customer complaints |
| Packaging | $1.2 million in annual savings |
| Precision Machining | 62% reduction in out-of-spec parts |
| Hospital ER | 28% reduction in average wait times |
| Semiconductor | 18% improvement in yield |
The Role of Control Charts in SPC
Control charts are key in Statistical Process Control (SPC). They show data over time. This helps tell normal from special changes. They track how a process performs, which is crucial for good quality in making things.
Types of Control Charts
Different control charts are made for certain data types and uses:
- X-bar and Range Charts: best for subgroup sizes of 2 to 10. They check the stability of subgroup means within control limits. These limits are set at three standard deviations from the mean.
- X-bar and Sigma Charts: good for bigger subgroups. They give a better view of how the process varies.
- Individual X and Moving Range (IX-MR) Charts: perfect for when there’s only one item in a subgroup. For example, watching each measurement on its own.
- Zone Charts: they mix features of X-bar and CUSUM charts. Data points are marked in zones of deviation to highlight issues.
- Cumulative Sum (CUSUM) Charts: they’re great for seeing changes in the mean. This is done by adding up deviations over time.
- Histograms: these plot sample means to study how often data patterns occur.

Interpreting Control Charts
Understanding control charts helps find why things vary and fix them fast. Control limits are usually three standard deviations from the mean. This separates normal changes from special ones. The Western Electric Rules guide spotting issues. For example, a data point outside the 3-sigma limit or several points near the control lines show problems.
Application in Various Industries
Control charts are important in many areas, not just making things. In healthcare, they check processes to keep care quality high. They can track how long it takes to give out medication. This finds issues like equipment problems or not enough staff. In finance, control charts spot weird things in transactions to stop fraud.
Using control charts in SPC lets companies watch and analyze in real time. This is key to making processes better and keeping up high-quality standards.
The rest of this article is reserved for members
To limit scraping bots (currently 40,000 hits per day!),
we had to restrict access to full articles and tools to registered members only.
to access all the rest.
FAQ
What is Statistical Process Control (SPC)?
SPC is a way to improve the quality of products. It uses statistics to watch and boost how consistent processes are. This method checks the quality of production in real time.
Why is SPC important in quality control?
SPC is key for keeping strict quality checks in different fields. It helps identify normal changes in processes. This leads to steady processes and better products, making operations more efficient.
What are control charts in SPC?
Control charts are key SPC tools. They show process data over time, highlighting normal and unusual changes. There are different charts like X-bar and R for various data needs.
How do control charts help in analyzing process variations?
Control charts spot issues early by showing what variations are out of the norm. This allows for quick fixes. Keeping processes stable and improving quality becomes easier.
What are the steps to implementing SPC in an organization?
To start SPC, businesses need good measurement methods and must assess them accurately. They should collect data systematically and use SPC charts effectively. A solid action plan based on SPC findings is crucial for timely actions.
What challenges are common when implementing SPC, and how can they be overcome?
Problems include misunderstanding data and poor equipment calibration. There’s also often pushback against new methods. Solving these issues requires comprehensive training, frequent system checks, and clear communication about SPC’s benefits.
What are the advantages of applying SPC in manufacturing processes?
Using SPC in manufacturing lessens process variability and boosts productivity. It lowers costs and makes customers happier. Businesses can adjust proactively for better quality, giving them a competitive advantage.
How does SPC contribute to process improvement in industries outside manufacturing?
SPC isn’t just for manufacturing. Its focus on data, stability, and ongoing improvement works in healthcare and finance too. It improves quality control and process upgrades in various sectors.
External Links on Statistical Process Control for Quality
International Standards
(hover the link to see our description of the content)
Glossary of Terms Used
Design of Experiment (DOE): a systematic method for planning, conducting, and analyzing controlled tests to evaluate the effects of multiple variables on a response variable, facilitating the identification of optimal conditions and interactions among factors.
Just In Time (JIT): a production strategy that aims to reduce inventory costs by receiving goods only as they are needed in the manufacturing process, thereby minimizing waste and increasing efficiency.
Measurement System Analysis (MSA): a statistical method used to evaluate the accuracy, precision, and reliability of measurement processes and instruments, ensuring that data collected is valid and consistent for decision-making in quality control and process improvement.
Repeatability and Reproducibility (R&R): a measurement system's ability to produce consistent results under the same conditions (repeatability) and across different conditions or operators (reproducibility), often evaluated through statistical methods to assess variability and reliability in data collection processes.
Statistical Process Control (SPC): a method of quality control that employs statistical techniques to monitor and control a process, ensuring it operates at its full potential by identifying variations and maintaining consistent output within specified limits.
Total quality management (TQM): a management approach focused on long-term success through customer satisfaction, involving all members of an organization in continuous improvement of processes, products, and services to enhance quality and performance.