Cpk 是衡量流程在客户定义的规格限度内生产输出能力的统计指标。与跟踪稳定性的控制图不同,Cpk 量化的是流程能力。它衡量流程在规格限度之间的中心程度,并考虑了流程变异。Cpk 值越高,表示流程能力越强。公式为 [latex]C_{pk} = minleft[frac{USL �8211; mu}{3sigma}, frac{mu �8211; LSL}{3sigma}right][/latex]。


(图片仅供参考)
Cpk 是衡量流程在客户定义的规格限度内生产输出能力的统计指标。与跟踪稳定性的控制图不同,Cpk 量化的是流程能力。它衡量流程在规格限度之间的中心程度,并考虑了流程变异。Cpk 值越高,表示流程能力越强。公式为 [latex]C_{pk} = minleft[frac{USL �8211; mu}{3sigma}, frac{mu �8211; LSL}{3sigma}right][/latex]。

While control charts tell you if a process is stable and predictable, they do not indicate if the process is actually meeting customer requirements. This is the role of 过程能力 indices, with Cpk being one of the most widely used. Cpk bridges the gap between the “voice of the process” (its mean [latex]\mu[/latex] and standard deviation [latex]\sigma[/latex]) and the “voice of the customer” (the Upper Specification Limit, USL, and Lower Specification Limit, LSL). The index is calculated by finding the distance from the process mean to the nearest specification limit and dividing it by three times the process standard deviation (representing half the natural process spread).
Cpk 中的“k”专门用于衡量过程均值相对于规格限的居中程度。一个完全居中的过程,其均值应正好位于上限 (USL) 和下限 (LSL) 的中间位置。如果过程均值向某个限值移动,即使整体过程离散程度(变异)保持不变,Cpk 值也会降低。这是因为随着过程均值接近规格限值,产生缺陷的风险会增加。Cpk 值为 1.0 表示该过程刚好能够满足规格要求(假设服从正态分布,则仍会预期存在少量缺陷)。许多行业,尤其是汽车行业,要求 Cpk 值达到 1.33 甚至 1.67,以确保高质量水平并为任何潜在的过程偏移提供缓冲。
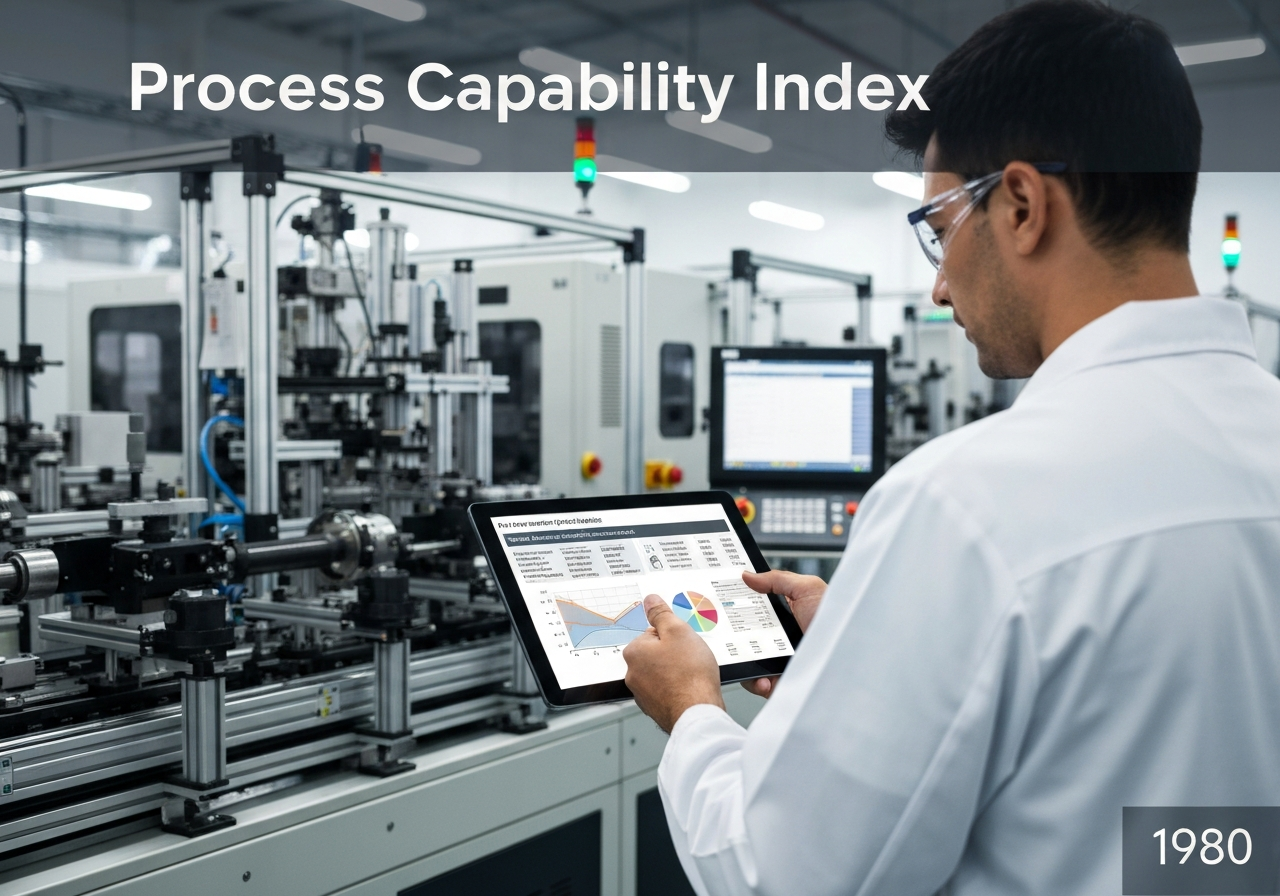
过程能力指数(Cpk)
(如果日期未知或不相关,例如“流体力学”,则提供其显著出现的近似估计)

只有注册会员才能免费获取完整尺寸的图片和下载内容。
> 登录 <