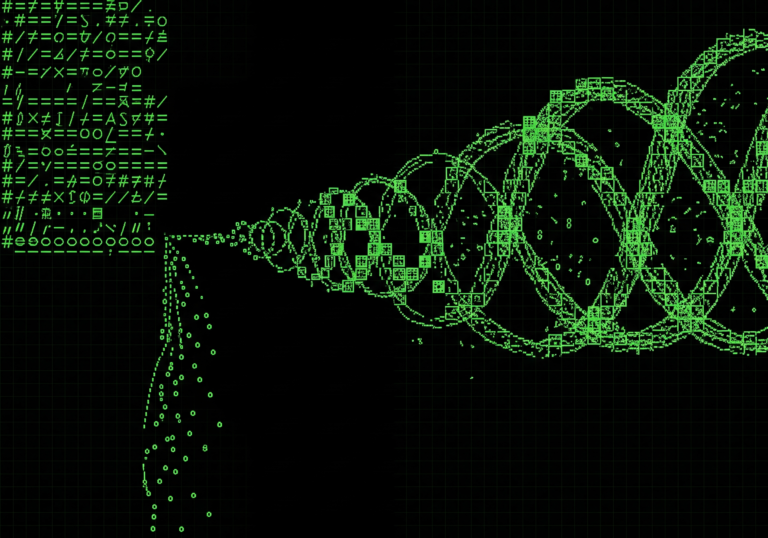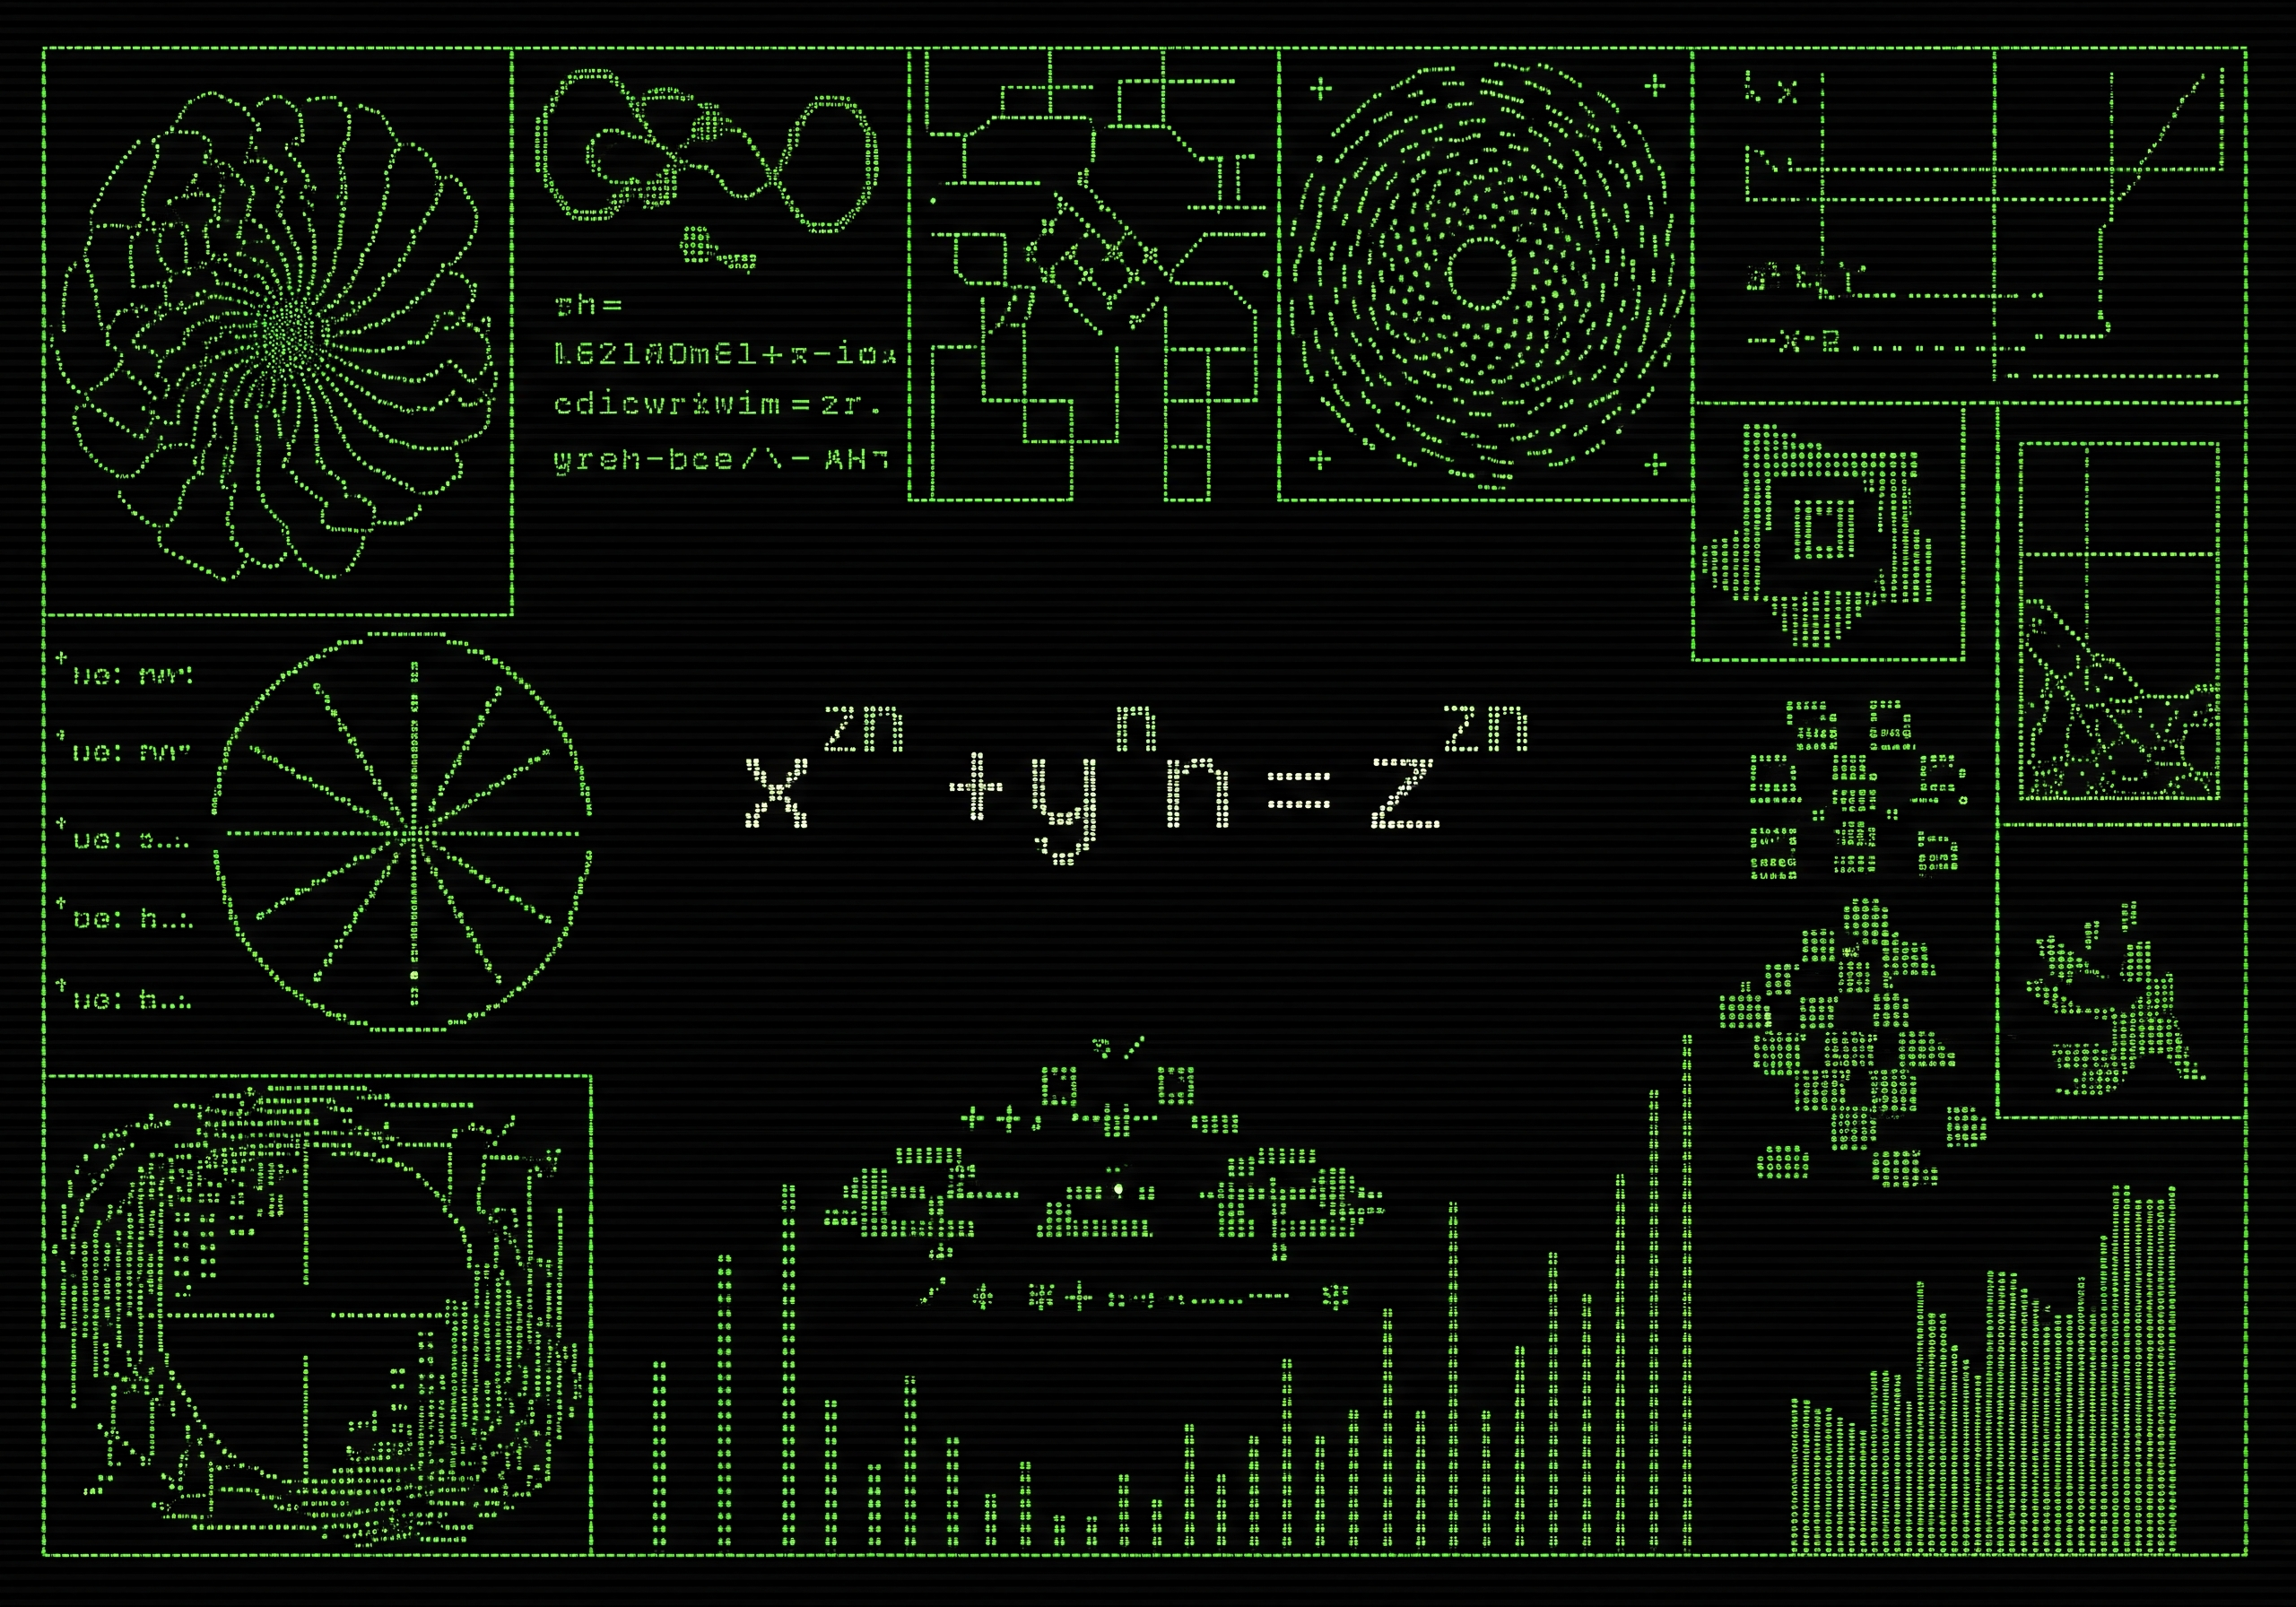
The image displays a grid filled with various mathematical and graphical illustrations in green. There are several spiral patterns, grids, and equations scattered across the layout. Central to the composition is the expression "x^n + y^n = z^n" prominently featured. Additional elements include graphs, a pie chart, and abstract shapes that resemble data visualizations. Some sections depict lines and shapes that suggest movement or directionality, while others indicate quantities or relationships.