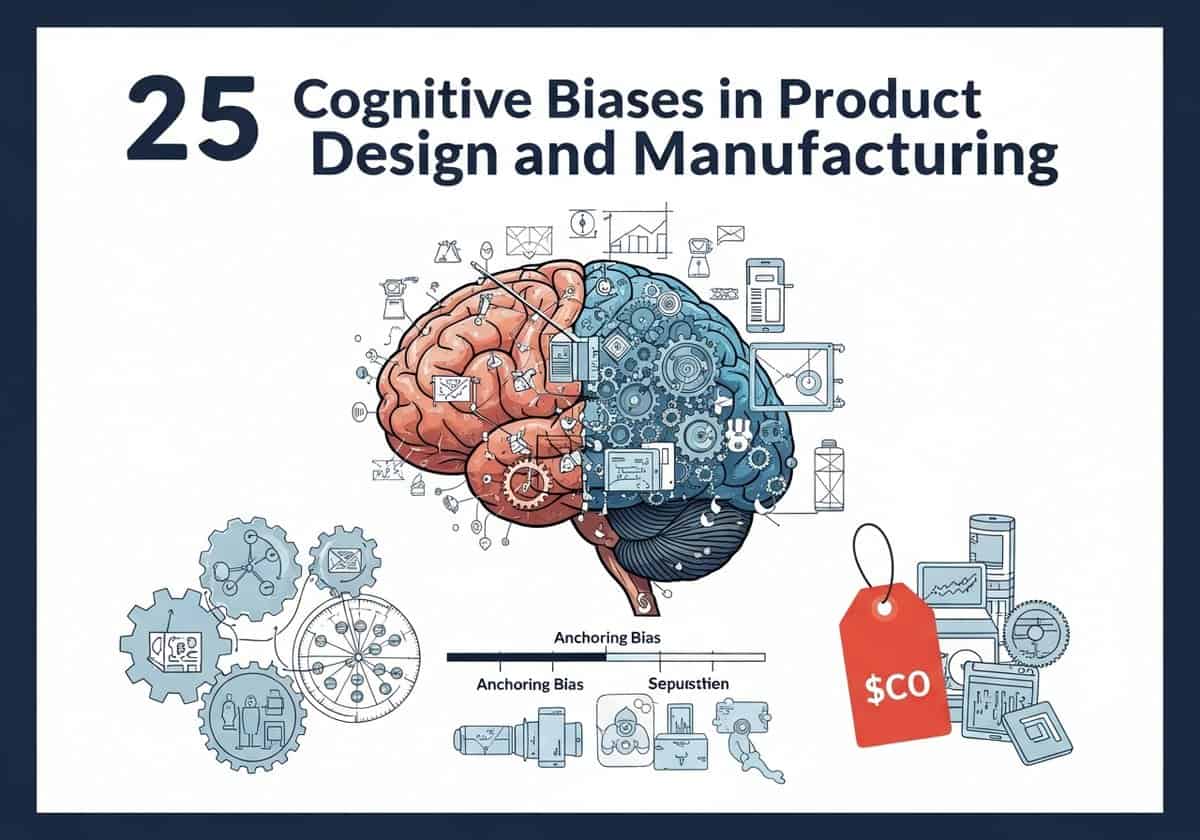
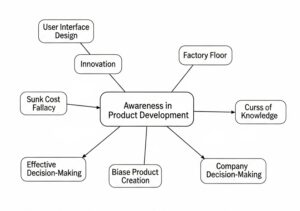
Cognitive biases are shortcuts in human thinking that shape all decisions. Product designers and engineers can improve their work by accounting for these inherent mental patterns. These shortcuts, while useful, also produce predictable, systematic errors in judgment. A working knowledge of these biases allows creators to build products that are more intuitive and successful because they align with how people’s minds actually operate.
This awareness extends beyond user interface design to the full product life-cycleイノベーションから工場現場まで。消費者の選択に影響を与えるのと同じバイアスが、社内にも影響を与える。 チーム 製品を開発し、その品質をチェックする担当者。サンクコストの誤謬は、チームを失敗プロジェクトに陥れる可能性があり、知識の呪いは、エンジニアが自分にとっては明確な指示書を作成しても、機械オペレーターにとっては混乱を招く可能性がある。これらのパターンを特定することは、2つの機能を持つツールである。より効果的な製品の作成に役立つだけでなく、企業の意思決定を洗練させ、高額なミスを減らすことにもつながる。
1. The Anchoring Bias
The tendency to rely too heavily on the first piece of information offered. In product development, initial estimates for budgets, timelines, or feature scope act as powerful anchors that are difficult to adjust. A project manager’s initial “2-month” timeline, even if a rough guess, becomes the benchmark for success, constraining engineering teams and discouraging innovative but more time-consuming solutions that may emerge after the project has started.
- Abused for: negotiations, pricing strategy, and managing stakeholder expectations. A high initial asking price makes a subsequent, lower price seem like a good deal, even if it is still above market value.
- Example in R&D: an early, overly optimistic result from a single experiment can anchor an entire research project’s expectations. The R&D team and management may cling to this initial “breakthrough,” making it difficult to objectively assess subsequent, less promising data and pivot the project towards a more viable path.
2. Availability Heuristic
Overestimating the importance of information that is easily recalled. A team might over-prioritize a feature addressing a problem that a high-profile competitor recently struggled with publicly, because that failure is vivid and “available” in their minds. This can divert engineering resources from addressing less sensational, but more prevalent, issues discovered in their own user research.
- Used for: marketing campaigns, news media, and risk assessment. Fear-based 広告 保険商品や安全関連商品を販売するために、鮮烈だが稀なネガティブな出来事を強調することが多い。
- 品質・製造における例:品質管理チームは、2年前に大規模で記憶に残る製品リコールを引き起こした特定の種類の欠陥に対して、厳しく時間のかかる検査手順を実施する一方で、より頻繁に発生するものの、それほど深刻ではない、現在顧客の不満を高めている品質問題にはあまり注意を払わない可能性がある。
3. The Bandwagon Effect

The tendency to adopt certain behaviors or beliefs because many other people are doing so.
これはしばしば、特定の製品やチーム文化への適合性を厳密に分析することなく、人気のあるテクノロジースタック、デザインシステム、またはプロジェクト管理手法(特定のアジャイルフレームワークなど)の採用を促すことになります。エンジニアリングリーダーは、プロジェクトの規模がそれを必要としているからではなく、「大手テクノロジー企業の誰もがそうしている」というだけの理由で、Kubernetesのような複雑なテクノロジーの使用を推進するかもしれません。
- Abused for: driving trends, viral marketing, and creating social proof for product adoption. It creates a “fear of missing out” (FOMO) that encourages people to join a growing movement.
- Example in innovation: an innovation department or company might feel pressured to invest heavily in Generative AI projects simply because it’s the dominant trend and competitors are all announcing their AI initiatives. This can lead to rushed, poorly conceived projects that chase the buzz rather than solving a genuine business problem.
4. 確証バイアス
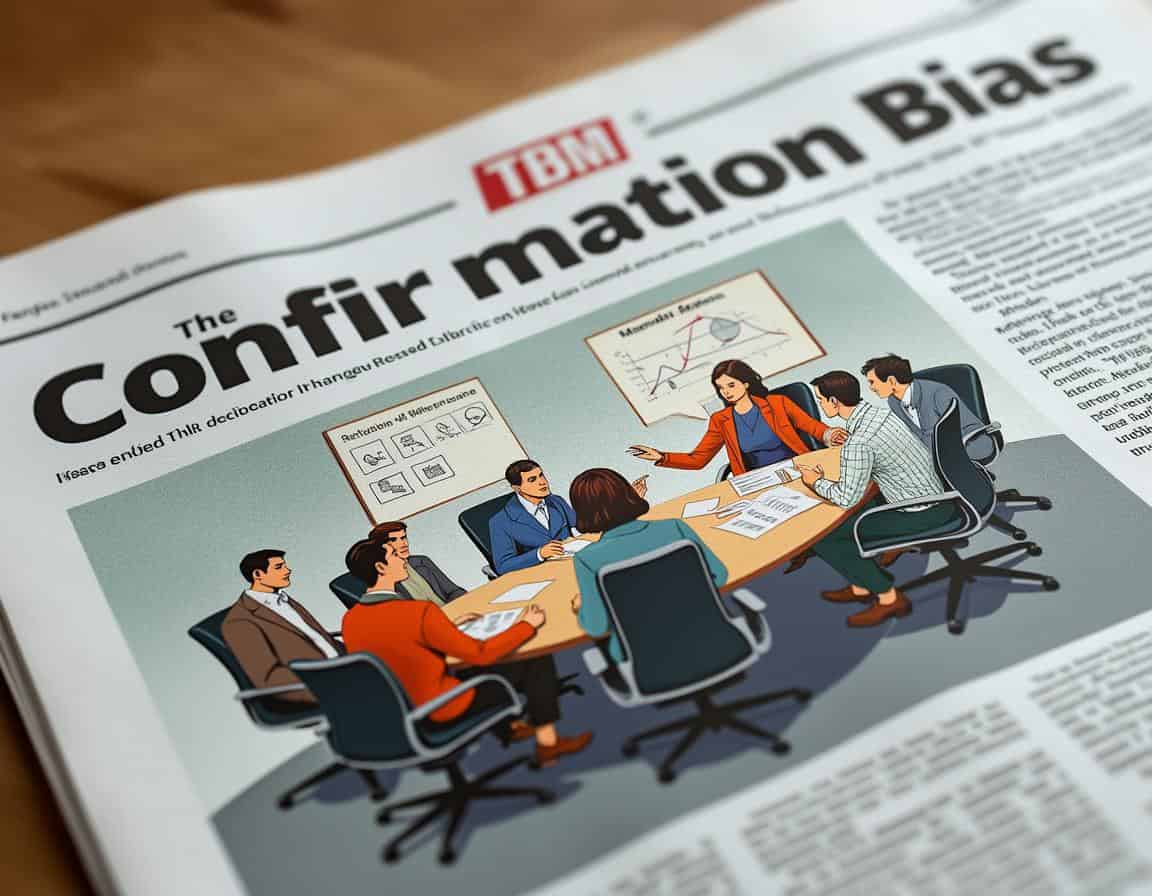
The tendency to search for, interpret, and recall information that confirms pre-existing beliefs.
The same bias explains why teams defend their own flaws, repeating that it’s not a bug it’s a feature long after users complain. The it’s not a bug it’s a feature meaning is exactly this: an unwanted behavior gets relabeled as intended once a team is attached to its design.
Once a team commits to a product idea, they subconsciously seek user feedback and data that validate their chosen path. During 使いやすさ テストの過程で、デザイナーが意図せず肯定的な反応を引き出すために誘導尋問をしたり、プロジェクトマネージャーが進捗状況を示す指標を強調する一方で、戦略の欠陥を示す指標を無視して、チームをさらに誤った方向へ導いてしまう可能性がある。
- Used for: creating echo chambers in social media feeds, political messaging, and reinforcing brand loyalty by feeding customers information that confirms the wisdom of their purchase.
- Example in R&D: a scientist who believes a specific molecule is the key to a new drug may unconsciously interpret ambiguous test results as positive evidence and dismiss contradictory data as anomalies or measurement errors. This can waste significant time and resources pursuing a dead end.
5. The Curse of Knowledge
The difficulty for experts to imagine what it’s like for someone who doesn’t have their level of knowledge. This is a primary source of friction between engineering and users. Engineers, who understand the system’s architecture, may design an interface or API that is logical from a technical standpoint but completely counter-intuitive for a new user who lacks that underlying mental model, resulting in a poor on-boarding experience and high support costs. This bias is more of an inherent obstacle. It manifests in jargon-filled presentations, overly complex user manuals, and “intuitive” interfaces that are only intuitive to their creators.
- Example in manufacturing: an engineer who designs a complex new assembly machine may write operating instructions that are perfectly clear to another engineer, but incomprehensible to the floor technician who has to use and troubleshoot it daily. This leads to operator errors, reduced efficiency, and potential safety risks. A similar problem can be in the writing of the Instruction For Use (IFU) for a product.
6. The Decoy Effect
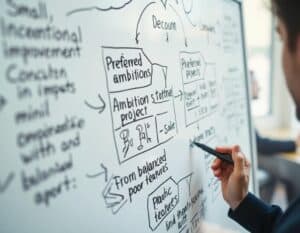
The phenomenon where people’s preference for one of two options can change when a third, asymmetrically dominated option is presented. In product strategy and project management, this can be used to guide stakeholder decisions. When presenting project roadmaps, a product manager might include a “decoy” option -one with an obviously poor balance of features versus engineering effort- to make their preferred strategic option seem more attractive and logical in comparison.
- Abused for: subscription pricing tiers and product line-ups. A “medium” popcorn is priced just slightly less than the “large,” making the large seem like a great value and the intended choice.
- Example in R&D: when pitching innovative projects for funding, a team can present three options: 1) A small, incremental improvement, 2) Their preferred, ambitious project, and 3) A “decoy” project that is almost as expensive as the ambitious one but offers far fewer benefits. The decoy makes the preferred project look like the most efficient and valuable choice.
7. The Default Bias

The tendency to stick with pre-set options.
The power of defaults is immense in both product design and engineering. For users, the default privacy settings or subscription plan can dictate behavior on a massive scale. Internally, the default configurations in a development environment or a “starter” project template will be used by the vast majority of engineers, making the choice of these defaults a critical decision that impacts security, efficiency, and code consistency across the organization.
- 用途:ニュースレターの登録率向上(オプトアウト方式とオプトイン方式の比較)、ソフトウェアのインストールオプションの設定、および全社的な401(k)加入手続きの確立。
- Example in quality: in a manufacturing setting, if the default setting on a machine is “standard tolerance,” most operators will use it for all jobs unless explicitly told otherwise. If a higher-quality product requires “tight tolerance,” relying on operators to remember to change it will lead to errors. Setting the default to the highest required quality standard (or the safest setting) is a powerful way to reduce defects.
ヒント: indeed, a default selected value can save time. But in some cases, it worth to have no default value and oblige the user or operator to “think” and apply or justify his choice.
8. The Dunning-Kruger Effect
The tendency for individuals with low ability at a task to overestimate their ability. In project planning, a manager with a limited understanding of a new technology might drastically underestimate its complexity, leading to unrealistic deadlines. Similarly, a junior engineer might confidently claim a task will take two days when it will actually take two weeks, causing cascading delays throughout the project plan.
This Bias is rarely used intentionally; its effects are mostly negative. It explains why novices can be overconfident and resistant to feedback, while experts are often more aware of their own limitations.
9. The Endowment Effect
The tendency to place a higher value on things one owns or has created.
This bias is a primary driver of resistance to change in engineering.
チームは自分たちが構築したコードやシステムに愛着を持ち(まるで「自分のもの」のように)、既存システムを守ろうとして、より近代的で効率的な技術への移行を拒むようになる。この「自社開発主義」症候群はイノベーションを阻害し、企業に高額な技術的負債を負わせることになる。
- Abused for: free trials and money-back guarantees. Once a user integrates a product into their life, the feeling of ownership makes them less likely to “lose” it by cancelling.
- Example in product development: an innovation team that has spent six months developing a prototype becomes heavily invested in it. When market feedback suggests the core concept is flawed, the team’s sense of “ownership” can cause them to defend the prototype and resist pivoting, arguing for “just a few more features” instead of acknowledging the need for a fundamental change.
10. フレーミング効果
Very frequently used, voluntary or involuntary, it consist in drawing different conclusions from the same information, depending on how it is presented. The perception of the project health is highly susceptible to framing:
Method a): the project manager reporting progress as “75% of features are code-complete” creates a positive frame of accomplishment
Method b): reporting the same status as “25% of critical code is still untested and un-integrated” creates a negative frame of risk, which can dramatically alter stakeholder confidence and decisions.
- Abused for: public relations, マーケティング, and political messaging. A medical treatment’s success can be framed as “90% survival rate” (positive) or “10% mortality rate” (negative).
- Another example in Quality Assurance: a QA report can frame its findings to influence action. Stating “the software passed 95% of test cases” encourages a launch decision. Framing the same data as “5% of tests failed, including 2 critical security vulnerabilities” will almost certainly halt the launch. The framing directly impacts the perception of product readiness.
11. The Halo Effect
The tendency for a positive impression in one area to positively influence one’s opinion in other areas. A product with a stunning, polished visual design often benefits from a halo effect, leading users and stakeholders to perceive it as more usable, secure, and well-engineered than it actually is. This can mask serious underlying usability flaws or technical debt, delaying critical feedback until after the product has launched.
- Used for: celebrity endorsements, luxury branding, and interviews. An articulate and charismatic candidate might be perceived as more competent, regardless of their actual skills.
- Example in R&D: a research proposal from a scientist who recently won a prestigious award may be scrutinized less rigorously by a funding committee. The “halo” of the award can lead the committee to overlook potential flaws in the experimental design or budget, assuming the entire proposal is as brilliant as the scientist’s past work.
12. Hick’s Law
The time it takes to make a decision increases with the number and complexity of choices. This applies equally to user interfaces and internal engineering systems. A settings menu with 50 options will overwhelm a user. Likewise, a microservices architecture with too many interdependent services and configuration flags creates immense cognitive load on engineers, making troubleshooting and innovation slow and error-prone.
This is primarily a principle to design against.
企業が意図的に紛らわしい選択肢を作成すると、悪用されることがあります。 軽く押す users toward a default or more expensive choice. It しなければならない be used constructively to simplify remote controls, application menus, and emergency procedures.
- Example in sales: never offer too many options to the customer: instead of pleasing him, he may not decide, and buy nothing at all!
- Example in Manufacturing: a control panel for a piece of factory machinery with dozens of unordered buttons and switches will slow down operators and increase the chance of error. A well-designed panel uses Hick’s Law by grouping related controls, hiding advanced options, and simplifying common workflows to reduce decision time and improve safety.
13. The IKEA Effect

Placing a disproportionately high value on products one has partially created. This is leveraged by products that involve user customization and setup.
In an enterprise or development context, when an engineering team invests significant effort in configuring and customizing a third-party platform (like a CRM or a data dashboard), they become heavily invested in it. This increases loyalty but can also make them resistant to switching to a better, simpler solution in the future because they don’t want to abandon their effort.
- Used for: building brand loyalty and user investment. Meal-kit services, build-a-bear workshops, and customizable online profiles all benefit from users valuing the final product more because of their own effort.
- Example in brainstorming: an innovation challenge that provides teams with a basic toolkit and requires them to build their own prototype can be more effective than just asking for ideas. The teams that invest the effort to build something, even if it’s rudimentary, will feel a stronger sense of ownership and be more passionate advocates for their innovative solution.
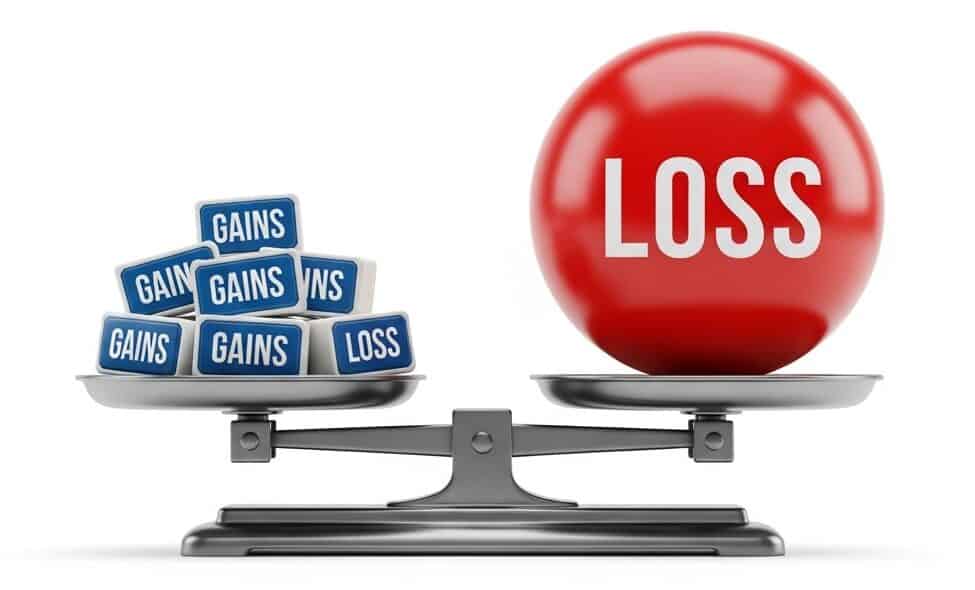
14. The Loss Aversion
The tendency to feel that the pain of a loss is twice as powerful as the pleasure of an equivalent gain.
This is a major impediment to product evolution and project agility. Proposing the removal of a rarely-used feature will trigger strong opposition from the few who use it (a perceived loss), which often outweighs the broad, diffuse benefit of a cleaner product for everyone else. This makes it psychologically and politically difficult for product managers to simplify and streamline their products.
- Abused for: driving urgency in sales with “limited-time offer” messages (avoid the loss of the deal) and in user retention by framing cancellation as “losing your benefits.”
- Example in manufacturing: proposing a change to a long-standing manufacturing process, even if data shows it will increase efficiency (a gain), will be met with strong resistance. Workers may focus on the “loss” of their familiar routine and perceived expertise, fearing the uncertainty of the new process more than they value the promised efficiency gains.
15. The Negativity Bias
Related to the Loss Aversion, the Negativity Bias is the tendency to give more weight to negative experiences than positive ones. In project retrospectives (“post-mortems”), teams often fixate on the one or two things that went wrong (a server outage, a missed deadline) while glossing over the dozens of things that went right. This can lead to a risk-averse culture that penalizes experimentation and discourages ambitious innovation.
- Used/Abused For: customer reviews and news reporting. A single one-star review can outweigh ten five-star reviews. Negative headlines get more clicks than positive ones.
- Example in Quality Assurance: a QA tester’s role is inherently focused on finding flaws, which can institutionalize negativity bias. They might produce a bug report that is a long list of minor issues, creating an overwhelming and demoralizing impression of the product’s quality, when in fact the core functionality is stable and the ユーザーエクスペリエンス is largely positive.
16. メンタルモデル
A person’s thought process for how something works in the real world. A critical failure point in product development is a mismatch between the engineer’s mental model and the user’s. For example, an engineer may think of “saving a file” as a distinct action, while a user accustomed to cloud apps has a mental model where work is saved continuously and automatically.
Designing against the user’s mental model leads to confusion and a steep learning curve.
This is a core concept in user experience design. It’s used to create intuitive interfaces that match user expectations (e.g., a shopping cart icon). It’s a source of problems when ignored, leading to user error.
- Example in Quality/Safety: in a manufacturing plant, if an emergency stop button is designed as a touchscreen icon (engineer’s mental model of a modern interface) but the universal mental model for workers under ストレス is a large, physical red button, this mismatch can lead to a catastrophic failure in an emergency. Quality and safety procedures must align with ingrained mental models.
17. The Mere Exposure Effect
With some commonalities with the Mental Model, this bias is the tendency to develop a preference for things merely because of familiarity. This is why engineering teams often resist adopting new tools or processes. They are comfortable with the existing toolchain (e.g., Jira, Jenkins) not because it is the best, but because they are familiar with its quirks and workflows. Overcoming this inertia is a key challenge for innovation in development practices.
- Abused for: advertising and branding. Seeing a brand ロゴ repeatedly, even subconsciously, builds a sense of familiarity and trust that can influence purchasing decisions.
- Example in R&D: a lab might continue to purchase measurement instruments from a specific brand, even when a competitor offers a more accurate or cheaper alternative. The researchers are simply more comfortable and familiar with the old brand’s interface and operation, and this preference born of familiarity can inhibit the adoption of superior technology.
18. The Peak-End Rule

Judging an experience largely based on how it was felt at its peak (most intense point) and at its end.
The overall perception of a year-long project is often not an average of the entire experience. Instead, the team and stakeholders will remember the most stressful week (the “peak”) and the final launch experience (the “end”).
ヒント: a skilled project manager can salvage a difficult project by ensuring the final weeks are smooth, successful, and celebratory, thus creating a positive lasting memory.
- Used for: designing customer service experiences and user journeys. A difficult installation process can be “saved” by a final, delightful success screen and a welcoming on-boarding tour.
- Example in innovation: when running a pilot program for an innovative new product, the experience must end on a high note. Even if there were mid-program glitches (peaks), ensuring the final off-boarding process is smooth, gathers positive feedback, and provides a “thank you” gift can leave participants with a much more positive overall memory of the innovation.
19. The Serial Position Effect
Very close to the Peak-End Rule, this one is the tendency to best recall the first and last items in a series. In critical meetings like a project kickoff or a quarterly review, stakeholders will most clearly remember what is said at the beginning and what is said at the end. Important information, such as the project’s primary goal or the biggest risk, should be communicated at the very start or summarized at the very end to ensure maximum retention and impact.
- Can be used for: structuring presentations, writing sales copy, and designing lists. Key benefits are listed first, and the call-to-action is placed at the very end.
- Example in Quality Control: when an inspector checks a batch of products, they may be most attentive at the beginning and end of the batch.
ヒント: this can be dangerous if it leads to less scrutiny for items in the middle. To counteract this, quality procedures should mandate randomized sampling or structured breaks to reset attention and ensure consistent inspection throughout the entire batch.
20. Reciprocity
肯定的な行動に対して肯定的な行動で応えるという社会規範。企業内では、これは部門横断的な連携を円滑にする接着剤となる。 コラボレーションエンジニアがわざわざデザイナーのプロトタイプのデバッグを手伝うと、デザイナーはそのエンジニアからの今後の設計アセットの依頼を優先する可能性が高くなります。このような非公式な相互協力のシステムは、正式なプロジェクト計画よりも物事を円滑に進める上で効果的な場合が多いのです。
- Abused in Marketing: content marketing (giving away a free ebook to get an email address), sales (offering free samples), and building social obligations.
21. Scarcity

The tendency to see more value in something that is perceived to be limited in supply. Product managers use this to create focus and drive decisions. By framing engineering time as a scarce resource (“We only have the bandwidth for one of these two features this quarter”), they force stakeholders to make difficult but necessary trade-offs, preventing scope creep and ensuring resources are allocated to the highest-priority initiatives.
- Abused in Marketing: driving sales with “limited edition” products, “only 3 left in stock” messages, and countdown timers for deals.
- Can be used positively if done seldom : to push rapid progress, an innovation team might be given a “scarcity” constraint: a small, fixed budget and a two-week timeline to develop a proof-of-concept. This scarcity of time and money forces the team to be highly creative, focus only on what’s essential, and avoid over-engineering, often leading to more inventive solutions.
22. The Self-Serving Bias
The tendency to attribute successes to personal skills and failures to external factors. When a product launch exceeds its goals, the engineering team may credit their “clean code” while the design team credits their “intuitive UX.” If it fails, the same teams may blame “unrealistic deadlines from management” or “a 不十分なマーケティング strategy.” This bias can prevent a team from learning the true lessons from both its successes and failures.
This is a self-preservation bias. It’s commonly seen in performance reviews and project post-mortems where individuals or teams deflect blame and claim credit.
- Example in R&D: if an experiment succeeds, the lead scientist may attribute it to their brilliant hypothesis and skill. If it fails, they may blame a faulty piece of equipment or a contaminated sample (external factors). This bias can prevent them from re-evaluating their core hypothesis, which may be the actual source of the failure.
23. The Social Proof

The tendency to assume the actions of others reflect correct behavior.
This is profoundly influential in technology choices. Engineering teams will often adopt a language, framework, or database not after a deep, first-principles analysis, but because a respected “unicorn” tech company uses it and has written blog posts about its success. This can lead to teams adopting solutions that are far too complex for their actual needs.
- Abused for: displaying customer testimonials, user counts (“Join 10 million users”), and influencer marketing to build trust and drive adoption.
- 製造業における例:工場長は、実績のない新しいロボット技術への投資に躊躇するかもしれません。しかし、主要な競合他社3社がその技術を既に導入し、生産性の向上を実現していることを知れば、同業他社からの実績という社会的証明が、投資を承認する最後の後押しとなる可能性があります。
24. The Sunk Cost Fallacy

With many similarities with The Endowment Effect, this one consists of continuing a behavior or endeavor as a result of previously invested resources (time, money, or effort).
This is one of the most destructive biases in product development. It compels project managers to continue pouring engineering resources into a failing feature or product because “we’ve already spent so much on it.” The inability to cut losses and pivot, due to an emotional attachment to sunk costs, has 導かれた countless innovative projects to a grinding halt.
This is a trap that people and organizations fall into. It’s used in arguments to justify continuing a failing project or war: “We can’t pull out now, because our soldiers’ lives would have been wasted.”
- Example in R&D: an organization might continue to fund a pharmaceutical research project for a drug that consistently shows poor efficacy and high side effects simply because $50 million has already been invested over five years. The rational decision would be to cut losses and reinvest in a more promising drug candidate, but the sunk cost makes this emotionally and politically difficult. See also “The Dead Horse” analogy.
25. The Zeigarnik Effect
The tendency for people to better remember uncompleted or interrupted tasks than completed tasks. This creates a persistent cognitive load for engineering teams, as unresolved bugs and pending feature requests linger in their minds.
ヒント: a savvy project manager can leverage this by using tools like Kanban ボードとプログレスバーは、「未完了ループ」を可視化し、チームがタスクを「完了」に進めるように促し、目標を達成します。 心理的 閉鎖。
- Abused for: creating cliffhangers in TV series and using progress bars in user profiles (e.g., “Your profile is 80% complete”) to motivate users to finish the task.
- Example in Manufacturing: on an assembly line, an incomplete product at a worker’s station creates a natural cognitive tension to finish it.
ヒント: this effect can be harnessed by ensuring that work-in-progress is always clearly visible. Conversely, if a worker is frequently interrupted and has too many incomplete tasks open at once, the resulting cognitive load can increase stress and the likelihood of errors.

結論
The intentional misuse of these cognitive triggers moves design from beneficial guidance to active manipulation. When product designers exploit biases like Loss Aversion to create addictive feedback loops, or use the Decoy Effect in “dark patterns” to trick people into more expensive choices, they breach user trust. This exploitation is not limited to customers; a project manager can misuse Anchoring to impose unrealistic deadlines on an engineering team, compromising quality and well-being. Such actions prioritize short-term gain over ethical responsibility, transforming psychological insight into a tool for deception.
This unethical conduct carries substantial legal and commercial risks.
Regulatory bodies now actively penalize companies for deceptive ユーザーインターフェース designs that trap consumers in subscriptions or obscure data collection practices.
In technical settings, misrepresenting safety data through Framing to downplay risks can lead to corporate negligence charges if a product fails. The resulting public backlash from such revelations can destroy a company’s 評判 far more completely than any financial penalty, eroding customer loyalty and repelling skilled applicants who refuse to work for a deceptive organization.
用語集
Application Programming Interface (API): 異なるソフトウェアアプリケーションが相互に通信し、連携することを可能にする一連の規則とプロトコルであり、システム間の機能統合とデータ交換を可能にする。
Conversion Rate (CR): ウェブサイトやランディングページへの訪問者のうち、購入やニュースレターへの登録など、目的の行動を完了した人の割合。コンバージョン数を総訪問者数で割って算出する。
Customer Relationship Management (CRM): a system for managing a company's interactions with current and potential customers, utilizing data analysis to improve business relationships, enhance customer retention, and drive sales growth. It integrates various communication channels and automates processes to streamline customer engagement.
instruction For Use (IFU): 医療機器または製品の適切な使用、取り扱い、メンテナンスに関する詳細情報を提供し、ユーザーの安全性と有効性を確保する文書。
User experience (UX): the overall satisfaction and perception of a user when interacting with a product, system, or service, encompassing usability, accessibility, design, and emotional response throughout the entire interaction process.
User Interface (UI): a system that enables interaction between users and software applications, encompassing visual elements, controls, and overall layout to facilitate user tasks and enhance experience.