Product Design, Manufacturing & Innovation Resources
家 » 電位-pH図(プールベ図)

電位-pH図(プールベ図)

1950
  • Marcel Pourbaix
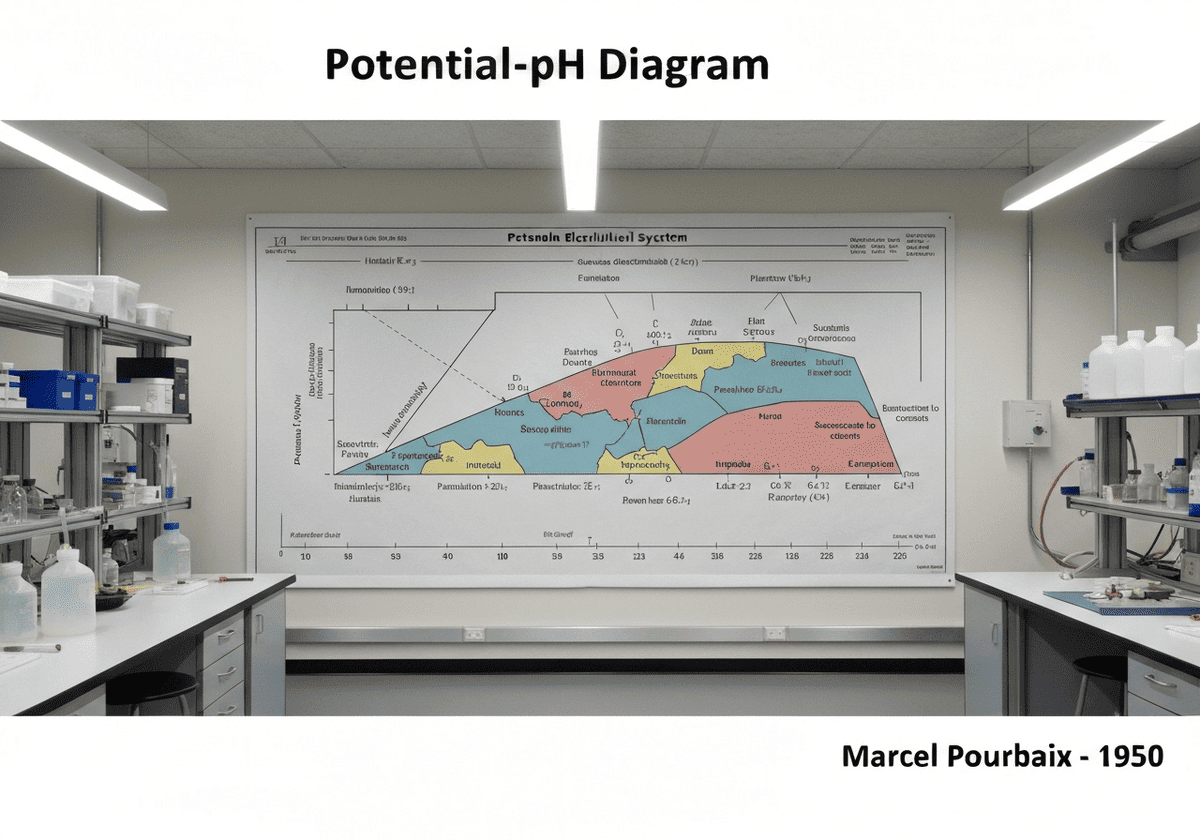
Pourbaix diagram detailing electrochemical stability of metals in aqueous systems.

(画像はイメージです)

プールベ図(電位/pH図とも呼ばれる)は、 熱力学 水溶液電気化学システムの安定平衡相を示す図。金属が不活性(熱力学的に安定)、不動態化(安定な保護膜を形成)する電位([latex]E_H[/latex])とpHの条件をグラフィカルに示している。 膜)、または腐食しやすい(可溶性イオンを形成する)。

プールベ図は、 ネルンスト この図は、金属酸化、酸化物/水酸化物生成、水安定性反応など、システム内で起こりうる様々な化学反応および電気化学反応を表す式です。図は、これらの反応の平衡条件を表す線によって領域に分割されています。線には主に3種類あります。水平線はpHに依存しない酸化還元反応、垂直線は電位に依存しない酸塩基反応、傾斜線はpHと電位の両方に依存する反応を表します。

この図には、水の安定性を表す2つの重要な線も含まれています。上の線より上では、水は酸化されて酸素になります([latex]2H_2O \rightarrow O_2 + 4H^+ + 4e^-[/latex])。下の線より下では、水は還元されて水素になります([latex]2H^+ + 2e^- \rightarrow H_2[/latex])。これら2つの線の間の領域は水の安定領域であり、ほとんどの水腐食はこの領域で発生します。

By plotting the potential and pH of a specific environment on the diagram for a given metal, one can predict its 熱力学 tendency. The ‘corrosion’ region indicates the metal will dissolve into ions. The ‘immunity’ region indicates the metal itself is the most stable form, so corrosion is thermodynamically impossible. The ‘passivation’ region indicates that a solid, often insoluble, oxide or hydroxide film forms on the surface, which can protect the underlying metal from further corrosion. However, it’s crucial to remember that these diagrams are based on thermodynamics and do not provide information about the kinetics or rate of corrosion.

UNESCO Nomenclature: 2203
電気化学

タイプ

抽象システム

混乱

実質的な

使用法

広く普及している

前駆物質

  • ヴァルター・ネルンストによるネルンスト方程式の定式化 (1889)
  • ジョサイア・ウィラード・ギブスの化学熱力学と相平衡に関する研究(1870年代)
  • 電位差測定法およびpH測定技術の進歩

アプリケーション

  • 様々な環境下における金属の腐食挙動の予測
  • designing corrosion protection strategies like 陰極防食
  • 鉱物の安定性を理解するための地球化学
  • 金属抽出プロセスにおける湿式冶金

特許:

NA

潜在的なイノベーションのアイデア

  • ai-driven software for generating complex multi-element pourbaix diagrams in real-time
  • dynamic pourbaix diagrams that incorporate kinetic data for more accurate corrosion rate prediction
  • micro-scale pourbaix diagrams for analyzing corrosion at grain boundaries in alloys
  • pourbaix-guided design of 触媒 for water splitting and co2 reduction
  • predictive models for biocorrosion based on localized ph and potential changes caused by microbes
  • interactive educational tools for materials science students using virtual pourbaix diagrams
  • development of corrosion inhibitors tailored to shift a system into the 不動態化 or immunity region
  • on-site electrochemical sensors that map real-world conditions onto a pourbaix diagram for asset integrity management
Related to: pourbaix diagram, potential-ph diagram, electrochemistry, corrosion, passivation, immunity, thermodynamics, nernst equation.

歴史的背景

電位-pH図(プールベ図)

1940
1947
1950
1950
1950
1950
1950
1938
1940
1950
1950
1950
1950
1950
1950

(日付が不明または関連性がない場合、例えば「流体力学」などでは、その注目すべき出現時期の概算値が提示されます。)

10年目 周年

フルサイズの画像とダウンロードは、登録会員のみが100%無料で利用できます。