Product Design, Manufacturing & Innovation Resources
집 » 전위-pH 도표(푸르베 도표)

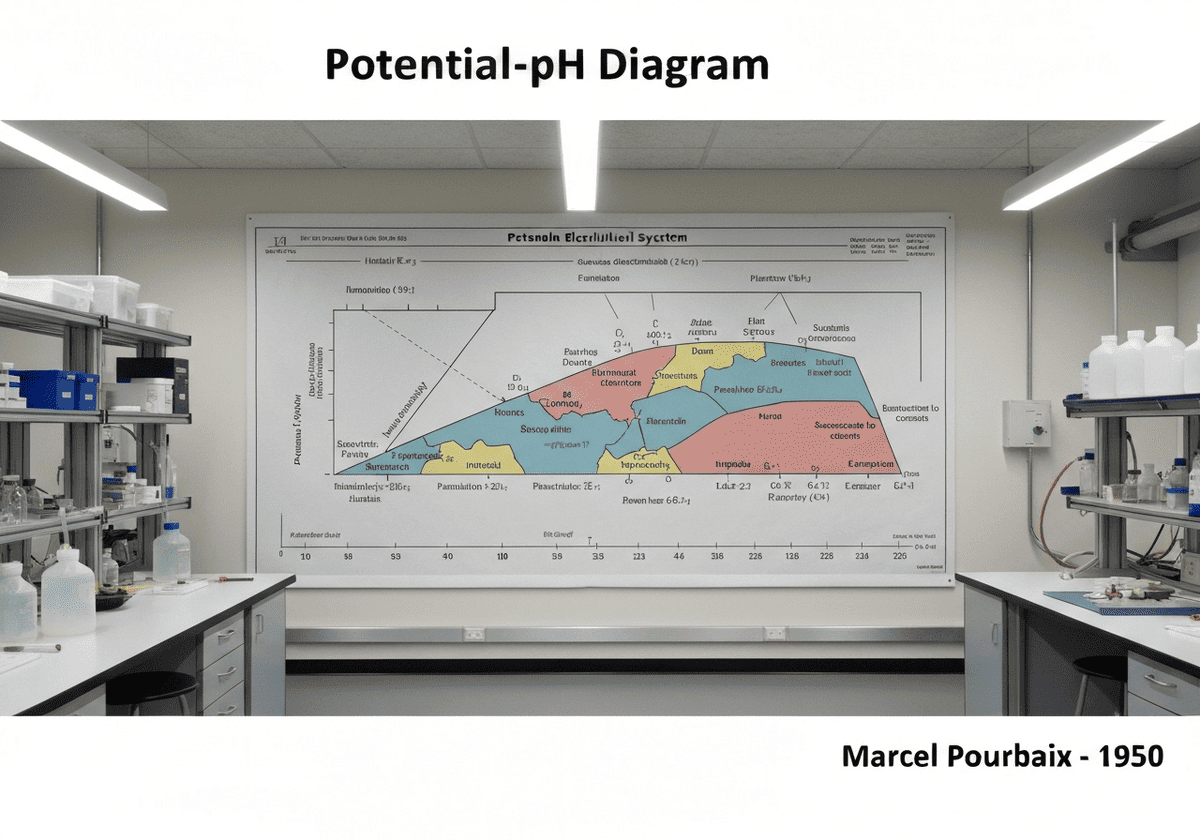
전위-pH 도표(푸르베 도표)

1950
  • Marcel Pourbaix
Pourbaix diagram detailing electrochemical stability of metals in aqueous systems.

(설명을 위한 생성된 이미지입니다)

푸르베 다이어그램(Pourbaix diagram), 또는 전위/pH 다이어그램이라고도 하는 것은 다음과 같습니다. 열역학적 수용액 전기화학 시스템의 안정적인 평형 상태를 나타내는 도표입니다. 이 도표는 금속이 열역학적으로 안정적인 상태(내성), 안정적인 보호막을 형성하는 상태(부동태화)가 되는 전위([latex]E_H[/latex]) 및 pH 조건을 그래프로 보여줍니다. 영화), 또는 부식에 취약합니다(용해성 이온을 형성합니다).

푸르베 도표는 다음을 사용하여 구성됩니다. 네른스트 이 그림은 금속 산화, 산화물/수산화물 생성, 물 안정화 반응을 포함하여 시스템 내에서 발생할 수 있는 다양한 화학적 및 전기화학적 반응에 대한 방정식을 나타냅니다. 그림은 이러한 반응의 평형 조건을 나타내는 선으로 영역별로 구분됩니다. 선에는 크게 세 가지 유형이 있습니다. 가로선은 pH에 독립적인 산화환원 반응을 나타내고, 세로선은 전위에 독립적인 산-염기 반응을 나타내며, 기울어진 선은 pH와 전위 모두에 의존하는 반응을 나타냅니다.

이 도표에는 물의 안정성을 나타내는 두 개의 중요한 선이 포함되어 있습니다. 위쪽 선 위에서는 물이 산화되어 산소가 되고([latex]2H_2O \rightarrow O_2 + 4H^+ + 4e^-[/latex]), 아래쪽 선 아래에서는 물이 환원되어 수소가 됩니다([latex]2H^+ + 2e^- \rightarrow H_2[/latex]). 이 두 선 사이의 영역이 물의 안정 영역이며, 대부분의 수용액 부식이 발생하는 영역입니다.

By plotting the potential and pH of a specific environment on the diagram for a given metal, one can predict its 열역학적 tendency. The ‘corrosion’ region indicates the metal will dissolve into ions. The ‘immunity’ region indicates the metal itself is the most stable form, so corrosion is thermodynamically impossible. The ‘passivation’ region indicates that a solid, often insoluble, oxide or hydroxide film forms on the surface, which can protect the underlying metal from further corrosion. However, it’s crucial to remember that these diagrams are based on thermodynamics and do not provide information about the kinetics or rate of corrosion.

UNESCO Nomenclature: 2203
전기화학

유형

추상 시스템

분열

상당한

용법

널리 사용됨

전구체

  • Walther Nernst의 Nernst 방정식 공식화(1889)
  • 조시아 윌라드 깁스의 화학 열역학 및 상평형 연구 (1870년대)
  • 전위차 측정법 및 pH 측정 기술의 발전

응용 프로그램

  • 다양한 환경에서 금속의 부식 거동 예측
  • designing corrosion protection strategies like 음극 보호
  • 광물 안정성 이해를 위한 지구화학
  • 금속 추출 공정을 위한 습식야금

특허:

NA

잠재적 혁신 아이디어

  • ai-driven software for generating complex multi-element pourbaix diagrams in real-time
  • dynamic pourbaix diagrams that incorporate kinetic data for more accurate corrosion rate prediction
  • micro-scale pourbaix diagrams for analyzing corrosion at grain boundaries in alloys
  • pourbaix-guided design of 촉매 for water splitting and co2 reduction
  • predictive models for biocorrosion based on localized ph and potential changes caused by microbes
  • interactive educational tools for materials science students using virtual pourbaix diagrams
  • development of corrosion inhibitors tailored to shift a system into the 패시베이션 or immunity region
  • on-site electrochemical sensors that map real-world conditions onto a pourbaix diagram for asset integrity management
Related to: pourbaix diagram, potential-ph diagram, electrochemistry, corrosion, passivation, immunity, thermodynamics, nernst equation.

역사적 맥락

전위-pH 도표(푸르베 도표)

1940
1947
1950
1950
1950
1950
1950
1938
1940
1950
1950
1950
1950
1950
1950

(날짜를 알 수 없거나 관련이 없는 경우, 예를 들어 "유체역학"의 경우, 주목할 만한 등장 시기를 대략적으로 추정하여 제공합니다.)

10년차 기념일

고화질 이미지 및 다운로드는 등록된 회원에게만 100% 무료로 제공됩니다.

> 로그인 <