Product Design, Manufacturing & Innovation Resources
Home » Partitioning of Variance (ANOVA)

Partitioning of Variance (ANOVA)

1925
  • Ronald A. Fisher
Statistician analyzing data in a 1920s office, focusing on variance partitioning.

(generated image for illustration only)

Analysis of Variance (ANOVA) is a statistical method that partitions the total observed variability in a data set into components attributable to different sources. The core idea is to compare the variance between the means of different groups to the variance within those groups. If the between-group variance is significantly larger, it suggests the group means are genuinely different.

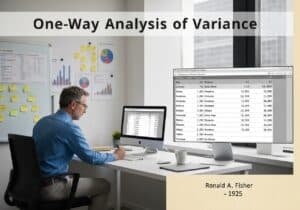
The fundamental principle of ANOVA, conceived by Ronald A. Fisher, revolutionized experimental design. Before ANOVA, researchers often used multiple t-tests to compare several groups, a practice that inflates the Type I error rate (the probability of a false positive). ANOVA provides a single test to check for any difference among group means. The technique works by decomposing the total variation in a dataset, measured by the Total Sum of Squares (\(SS_{Total}\)), into two parts. The first part is the Sum of Squares Between groups (\(SS_{Between}\)), which measures the variation of each group’s mean from the overall grand mean. This represents the variation explained by the grouping factor. The second part is the Sum of Squares Within groups (\(SS_{Within}\)), which measures the variation of each observation from its own group’s mean. This represents the unexplained or random variation, often called error. If the variation between groups is substantially larger than the variation within groups, it provides evidence that the grouping factor has a significant effect on the outcome variable. This comparison is formalized through the F-statistic.

UNESCO Nomenclature: 1209
– Statistics

Type

Abstract System

Disruption

Revolutionary

Usage

Widespread Use

Precursors

  • Theory of errors (Carl Friedrich Gauss, Pierre-Simon Laplace)
  • Method of least squares (Adrien-Marie Legendre, Carl Friedrich Gauss)
  • Correlation coefficient (Karl Pearson)
  • Student’s t-test (William Sealy Gosset)

Applications

  • experimental design in agriculture to compare crop yields
  • clinical trials in medicine to test drug efficacy
  • quality control in manufacturing to monitor process stability
  • psychological research to compare treatment effects
  • marketing analytics for A/B/n testing of website designs

Patents:

NA

Potential Innovations Ideas

  • optimizing supply chain logistics by analyzing delays across different carriers
  • personalized medicine by identifying patient subgroups that respond differently to treatments
  • climate change modeling by attributing temperature variance to natural vs. anthropogenic factors
  • algorithmic trading by testing the performance of strategies under different market volatility regimes
  • social media content optimization by comparing engagement metrics across various post formats
  • crime pattern analysis to determine if rates differ significantly between neighborhoods
  • evaluating the effectiveness of different online learning platforms on student performance
  • assessing the impact of urban green spaces on residents’ mental well-being across different city zones
  • optimizing battery life in mobile devices by testing different software configurations
  • analyzing genomic data to find associations between gene variants and disease susceptibility
Related to: ANOVA, variance partitioning, sum of squares, experimental design, statistical modeling, F-test, between-group variance, within-group variance, Ronald Fisher, statistics.

Historical Context

Partitioning of Variance (ANOVA)

1903
1914
1922
1925
1928
1930
1936
1900
1911
1920
1924
1925
1930
1931
1939

(if date is unknown or not relevant, e.g. "fluid mechanics", a rounded estimation of its notable emergence is provided)

10th year anniversary

Full size images and downloads are only available, 100% free, for registered members.

> Login <