
Wolfram Alpha Science Reference & Computational
Provides engineering information and problem solving techniques and maths, all powered by a powerful search engine: WolframAlpha functions as a
Provides engineering information and problem solving techniques and maths, all powered by a powerful search engine: WolframAlpha functions as a

Provides all the statistical tables when MS Excel has no formula to compute it automatically. All these tables here are

An online version of Octave, a a high-level language for numerical computations and plots: Octave Online provides a cloud-based integrated

Free and open-source software for numerical computation providing a powerful computing environment for engineering and scientific applications: Scilab a high-level

Your formula to 2D plots instantly: high-performance computational engine designed for real-time mathematical visualization and symbolic manipulation. It facilitates the
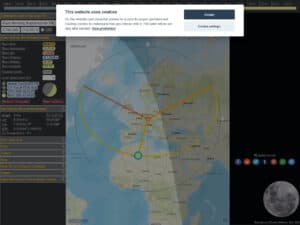
Get for any place on earth, all the relative moon data (elevation, distance, related trajectory over the day …)Your current

Free, no registration and full of features wordcloud generator. Of course you can select the texts, but also fonts, deformations/warping,

An excel like sheet, but with much more graphics power, for any king of charts and combinations of it. Steep