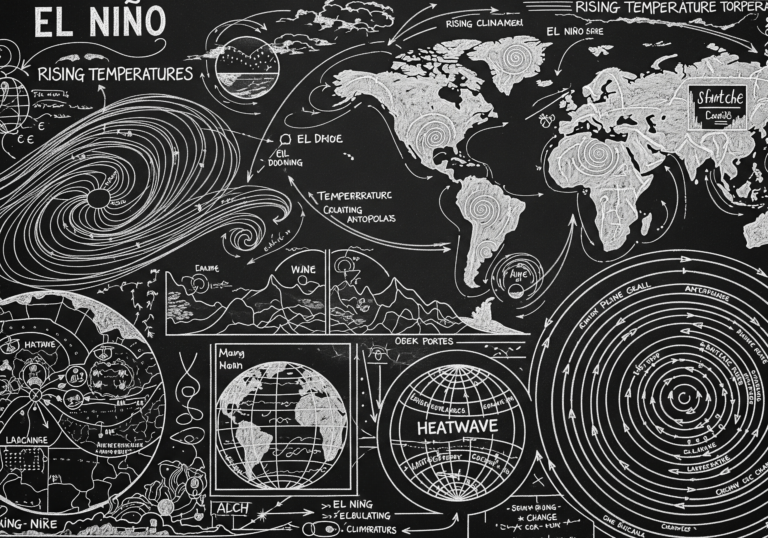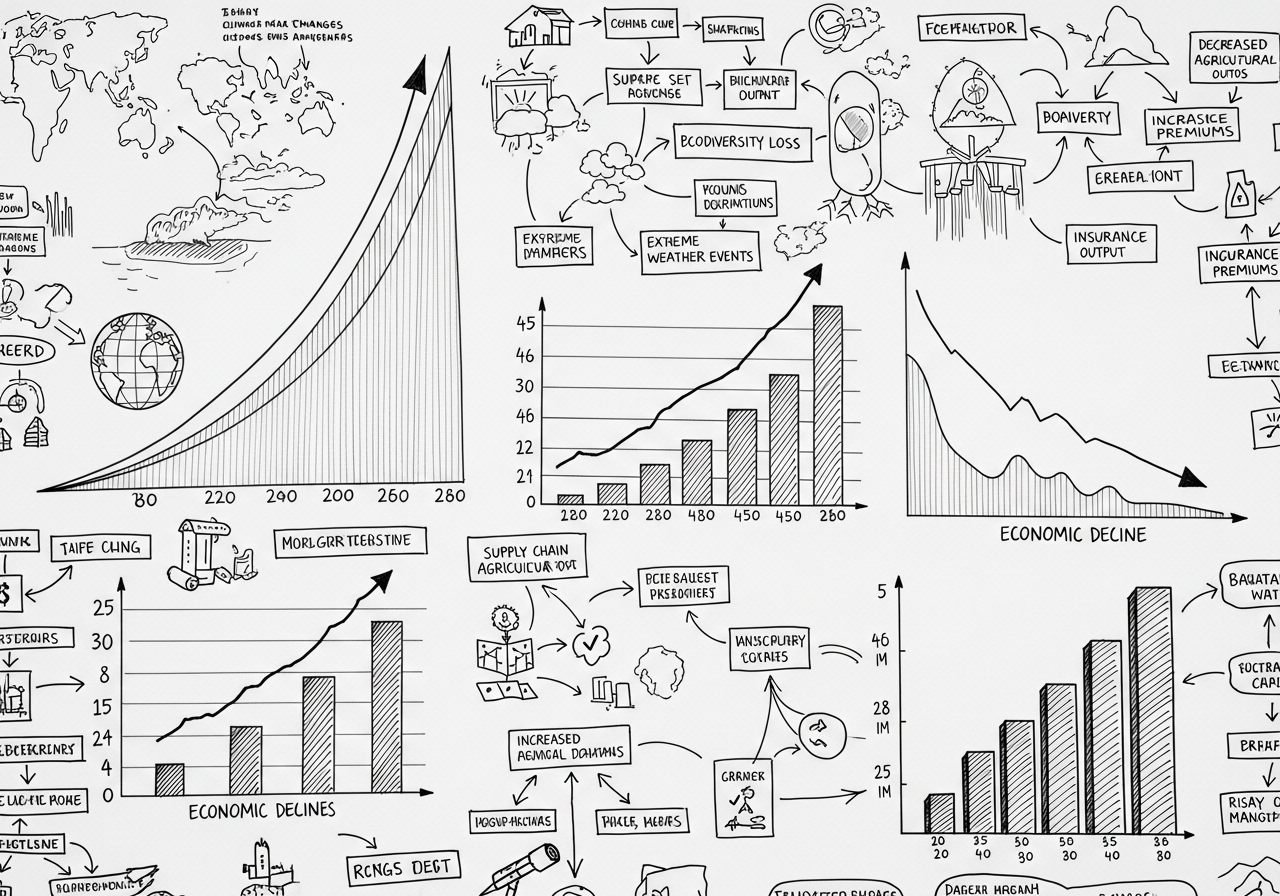
The image features various graphs and charts with labeled data points, depicting trends related to climate changes and economic factors. There are upward and downward curves shown, indicating increases and decreases in certain metrics over time. Additionally, symbols like the Earth, houses, and clouds are included alongside arrows connecting different concepts such as biodiversity loss and extreme weather events. The layout appears to be organized into sections, each addressing different aspects of the overall topic of climate impact and economic implications.