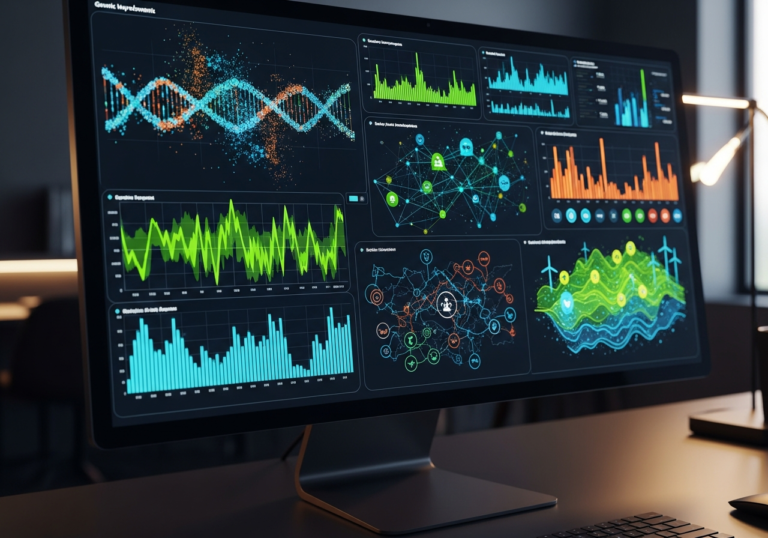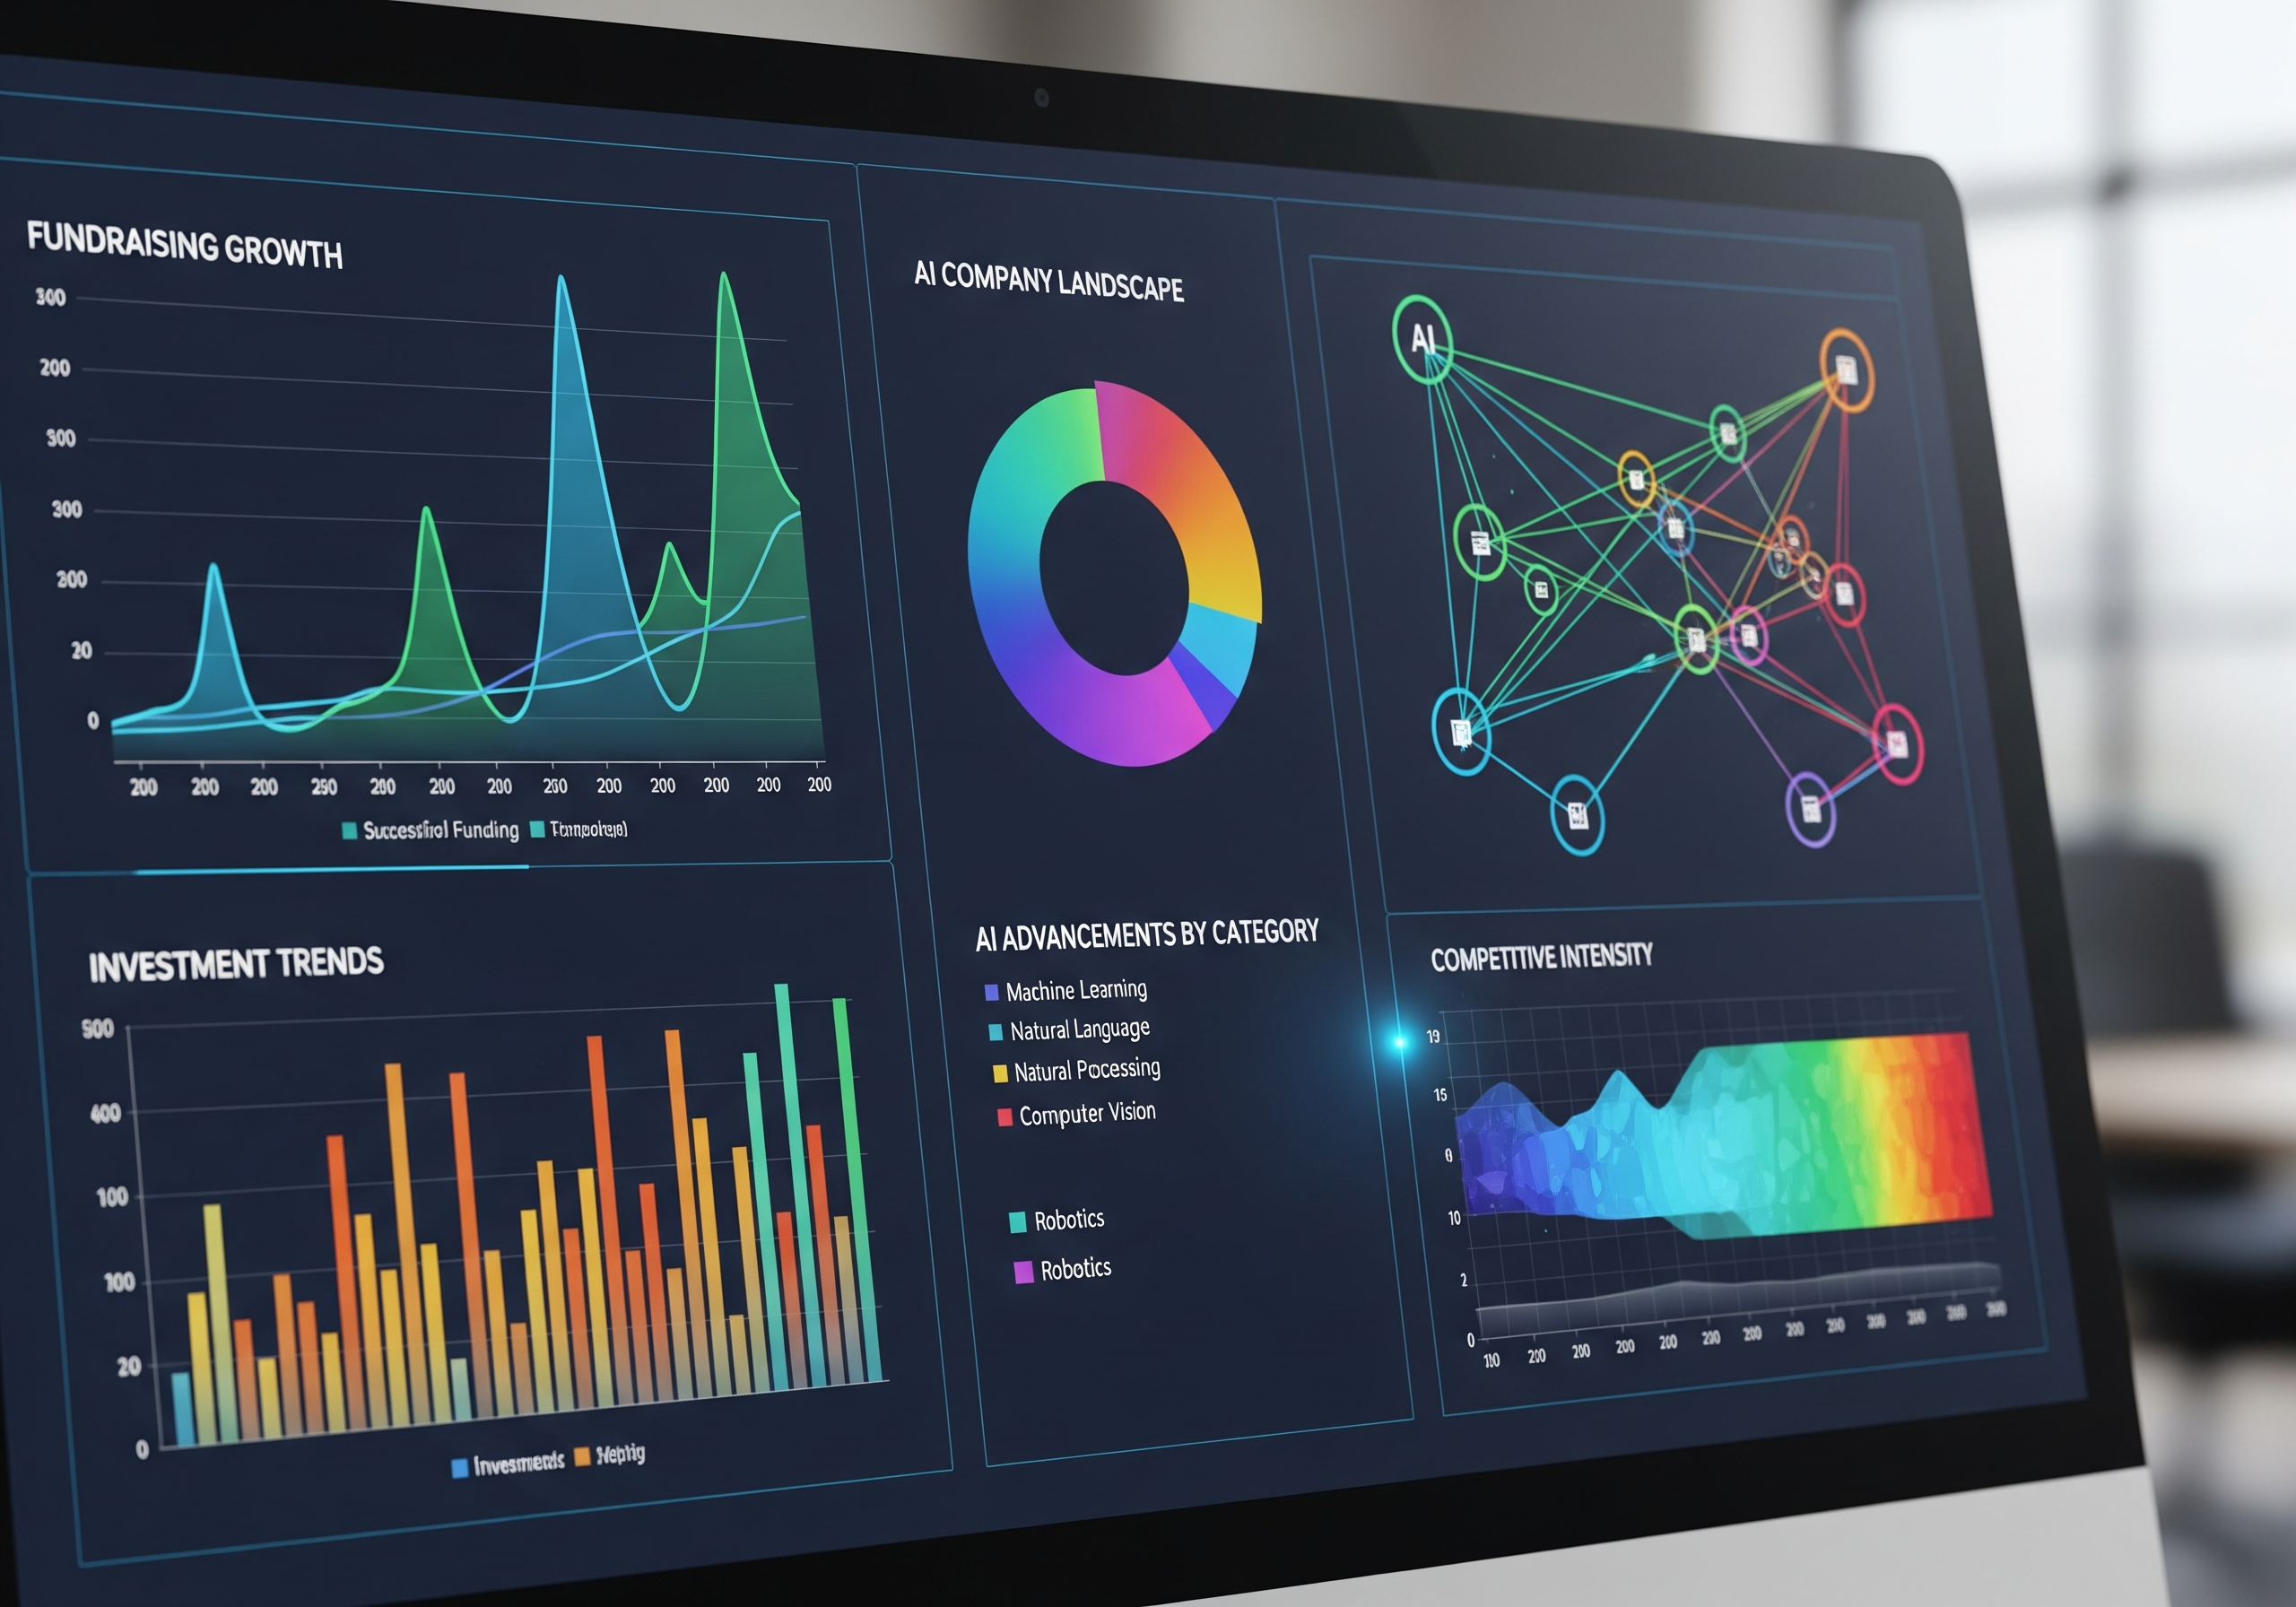
The image shows a computer screen displaying various data visualizations related to artificial intelligence. There are multiple charts, including a line graph for fundraising growth, a pie chart for AI advancements by category, and a bar graph for investment trends. Another section features a network diagram labeled "AI Company Landscape" illustrating connections between different entities. Additionally, there is a competitive intensity chart showcasing data trends over time.