Visualisierung des physischen Flusses von Personen, Materialien oder Informationen innerhalb eines Arbeitsbereichs oder Prozesses, um verschwendete Bewegungen und Transporte zu identifizieren und zu reduzieren.
- Methodologien: Kunden & Marketing, Wirtschaft, Produktdesign
Spaghetti-Diagramm
Spaghetti-Diagramm
- Kontinuierliche Verbesserung, Design für Nachhaltigkeit, Wirkungsgrad, Ergonomie, Schlanke Fertigung, Prozessverbesserung, Prozessabbildung, Wertstrom-Mapping, Abfallreduzierung
Zielsetzung:
Wie es verwendet wird:
- Eine kontinuierliche Linienzeichnung auf einem Grundriss oder einer Prozesskarte, die den Weg eines Gegenstands oder einer Person nachzeichnet. Das sich daraus ergebende Liniennetz (ähnlich wie Spaghetti) macht Ineffizienzen wie übermäßige Laufwege, Rückverfolgung und unnötige Bewegungen deutlich.
Vorteile
- Einfacher und visueller Weg zur Identifizierung verschwendeter Bewegung; Erleichtert die Kommunikation über ineffiziente Prozesse; Hilft bei der Gestaltung effizienterer Layouts; Bezieht Mitarbeiter in die Prozessverbesserung ein.
Nachteile
- Kann bei komplexen Prozessen oder mehreren Gegenständen/Personen zeitaufwändig sein; konzentriert sich in erster Linie auf physische Bewegungen, erfasst möglicherweise keine anderen Arten von Abfall; Genauigkeit hängt von sorgfältiger Beobachtung ab.
Kategorien:
- Ergonomie, Lean Sigma, Herstellung, Problemlösung
Am besten geeignet für:
- Identifizierung und Eliminierung von unnötigen Bewegungen und Transporten durch visuelle Darstellung des Weges von Produkten, Materialien oder Personen.
Spaghetti Diagrams are particularly useful in various sectors, such as manufacturing, healthcare, and logistics, where the physical movement of items or personnel is frequent and critical. In manufacturing settings, these diagrams can ensure that assembly lines are designed to minimize the distance traveled by workers and materials, thus enhancing production efficiency. In healthcare, analyzing patient and staff movements through facility spaces can lead to improved layouts that promote better patient care and reduce wait times. During the project planning phase, team members including engineers, project managers, and process improvement specialists can collaborate to create these diagrams, using tools like floor plans or process maps to visualize current workflows. This iterative approach not only identifies bottlenecks and redundancies but also encourages staff to participate actively by sharing their insights on day-to-day operations, which can lead to a sense of ownership over the process improvements. Historically, companies such as Toyota have effectively utilized Spaghetti Diagrams as part of Lean methodologies to eliminate waste, demonstrating the practical application within Lean Six Sigma frameworks. Adopting this methodology can also be advantageous when exploring new facility designs, as it provides a baseline for measuring the effects of any changes made.
Die wichtigsten Schritte dieser Methodik
- Select the area to be analyzed and obtain an accurate floor plan or process map.
- Trace the actual path taken by the item or person within the area.
- Use a continuous line to represent movements, ensuring clarity of the drawn path.
- Look for areas with excessive movement, backtracking, or unnecessary interactions.
- Identify specific locations where processes can be streamlined or redesigned.
- Engage with stakeholders to discuss observed patterns and seek collaborative solutions.
- Consider alternative layouts or processes to minimize wasted motion.
- Implement changes and monitor their effectiveness through further analysis.
Profi-Tipps
- Incorporate quantitative metrics alongside the spaghetti diagram to correlate movement efficiencies with performance objectives, providing a data-driven perspective.
- Conduct team workshops to collaboratively create and analyze the spaghetti diagram, ensuring diverse viewpoints contribute to identifying inefficiencies.
- Iterate the layout design based on findings from the spaghetti diagram, using simulation tools to visualize changes before implementation, fostering better decision-making.
Verschiedene Methoden lesen und vergleichen, Wir empfehlen die
> Umfassendes Methoden-Repository <
zusammen mit den über 400 anderen Methoden.
Ihre Kommentare zu dieser Methodik oder zusätzliche Informationen sind willkommen auf der Kommentarbereich unten ↓ , sowie alle ingenieursbezogenen Ideen oder Links.
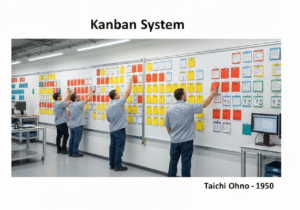
Historischer Kontext


1949
1950
1950
1960
1960
1960
1960
1940
1950
1950
1958
1960
1960
1960
1960


(wenn das Datum nicht bekannt oder nicht relevant ist, z. B. "Strömungsmechanik", wird eine gerundete Schätzung des bemerkenswerten Erscheinens angegeben)
Verwandte Artikel
Fragebögen zu muskuloskelettalen Beschwerden
Multivariate Tests (MVT)
Mehrfache Regressionsanalyse
Motion-Capture-Systeme
MoSCoW-Methode
Moods Median-Test