PERT (Program Evaluation and Review Technique): a project management technique used for planning and controlling projects with uncertain task durations, by using probabilistic time estimates (optimistic, pessimistic, and most likely) to determine the expected duration of activities and the project.
- Methodologien: Kunden & Marketing, Wirtschaft, Produktdesign
PERT Diagram
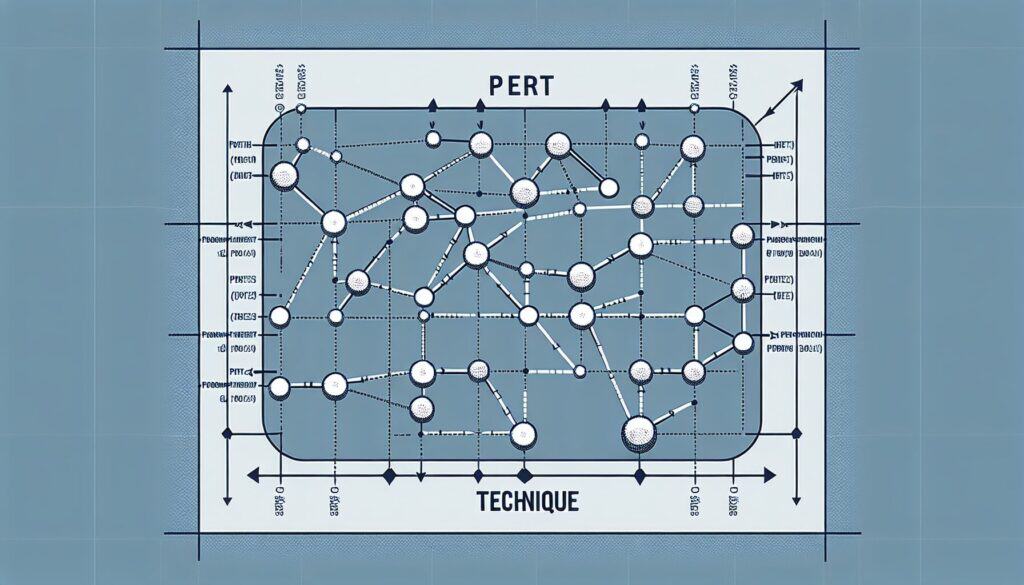
PERT Diagram
- Agile Methodik, Kontinuierliche Verbesserung, Prozess-Optimierung, Program Evaluation and Review Technique (PERT), Projektmanagement, Qualitätsmanagement, Forschung und Entwicklung, Risikomanagement
Zielsetzung:
Wie es verwendet wird:
- For each task, three time estimates are made: optimistic (to), pessimistic (tp), and most likely (tm). These are used to calculate an expected duration (te = (to + 4tm + tp)/6). These expected durations are then used to determine the critical path and project duration, often incorporating probabilities.
Vorteile
- Accounts for uncertainty in task durations, providing a more realistic schedule; Helps identify critical tasks and potential project risks related to time; Allows for calculating the probability of meeting project deadlines.
Nachteile
- Requires more effort to estimate three durations for each task; The probabilistic calculations can be complex; Relies on subjective estimates, which may be biased; The underlying beta distribution assumption may not always hold true.
Kategorien:
- Projektmanagement, Risikomanagement
Am besten geeignet für:
- Planning and managing complex projects where activity durations are uncertain, particularly for R&D or novel projects.
The PERT (Program Evaluation and Review Technique) Diagram methodology is widely applied in various industries such as aerospace, software development, construction, and pharmaceuticals, especially during the planning and execution phases of projects that involve a high degree of uncertainty. In R&D projects or innovative product development, where activities might be novel and time estimates less predictable, PERT’s focus on evaluating optimistic, pessimistic, and most likely scenarios allows teams to create a more accurate picture of project timelines. This methodology is particularly useful during the initial stages of a project when decisions regarding resource allocation and task prioritization are made, helping project managers assess potential bottlenecks and allocate efforts accordingly. The involvement of stakeholders throughout the project, including engineers, designers, and project managers, ensures that diverse perspectives inform the estimations, leading to more reliable projections. PERT also facilitates scenario analysis, enabling teams to gauge the impact of various factors on the expected project duration and to assess the probability of completing tasks on time. Regularly updating the PERT diagram can help teams adjust their plans based on real-time data, which is important as unforeseen challenges arise. In this context, the methodology not only aids in time management but also encourages collaboration and communication among team members, fostering a project environment that can adapt to changing requirements.
Die wichtigsten Schritte dieser Methodik
- Define the project tasks and milestones.
- Estimate three time durations for each task: optimistic (to), most likely (tm), and pessimistic (tp).
- Calculate the expected duration (te) for each task using the formula te = (to + 4tm + tp)/6.
- Create a PERT diagram illustrating the tasks, their dependencies, and expected durations.
- Identify the critical path by determining the longest path through the PERT diagram.
- Analyze the probabilities of completing the project by specific deadlines based on the critical path.
- Use the PERT diagram to monitor progress and adjust timelines as needed throughout the project.
Profi-Tipps
- Regularly update time estimates based on project progress to refine predictions and adjust the PERT Diagram effectively.
- Integrate Monte Carlo simulation alongside the PERT analysis to quantify risks and variances in project timelines.
- Collaborate with cross-functional teams during planning to gather diverse inputs for each time estimate, enhancing accuracy.
Verschiedene Methoden lesen und vergleichen, Wir empfehlen die
> Umfassendes Methoden-Repository <
zusammen mit den über 400 anderen Methoden.
Ihre Kommentare zu dieser Methodik oder zusätzliche Informationen sind willkommen auf der Kommentarbereich unten ↓ , sowie alle ingenieursbezogenen Ideen oder Links.
Historischer Kontext


1949
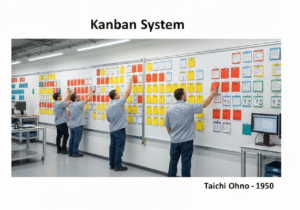
1950
1950
1960
1960
1960
1960
1940
1950
1950
1958
1960
1960
1960
1960


(wenn das Datum nicht bekannt oder nicht relevant ist, z. B. "Strömungsmechanik", wird eine gerundete Schätzung des bemerkenswerten Erscheinens angegeben)
Verwandte Artikel
Fragebögen zu muskuloskelettalen Beschwerden
Multivariate Tests (MVT)
Mehrfache Regressionsanalyse
Motion-Capture-Systeme
MoSCoW-Methode
Moods Median-Test