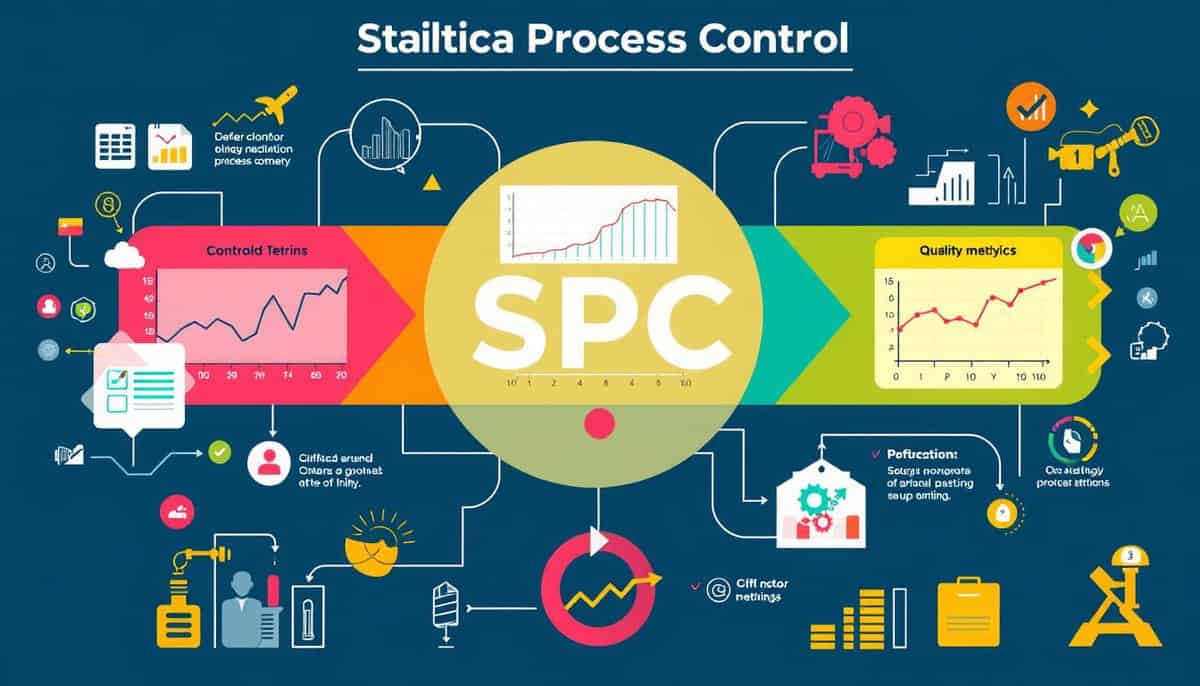
Statistical Process Control (SPC) is key in quality management. It gives real-time insights to keep process performance and product quality high. This method is essential in manufacturing for tracking processes and cutting unwanted variations.
تتيح مراقبة الأداء الفردي للشركات تحسين عملياتها وتقليل العيوب وزيادة الإنتاجية. من خلال الأدوات الإحصائية، يمكن للمؤسسات اكتشاف الأسباب المختلفة للتغييرات. وهذا يسمح لها بإصلاح المشاكل بسرعة والحفاظ على الجودة العالية.
النقاط الرئيسية
- تساعد مراقبة الأداء الفردي في تحديد الأسباب الشائعة والخاصة للتباين في التصنيع.
- يعد الاستخدام الفعال لمخططات التحكم أمرًا حاسمًا لتحسين العمليات في مراقبة الأداء الفردي.
- يعود التطور التاريخي لتقدير الأداء الفردي إلى عمل والتر أ. شيهارت في عشرينيات القرن الماضي.
- تُعد أحجام العينات المثلى وجمع البيانات المناسبة أمرًا حيويًا لإجراء تحليل دقيق لمعيار مراقبة الأداء وتقييم الأداء.
- تسهل المراقبة والتحليل في الوقت الفعلي الحفاظ على معايير عالية الجودة.
فهم أساسيات التحكم في العمليات الإحصائية (SPC)
التحكم الإحصائي في العمليات (SPC) هي تقنية حاسمة في التصنيع والصناعات الأخرى اليوم. وهي تستخدم التحليل الإحصائي لمراقبة العمليات، بهدف تحقيق نتائج عالية الجودة. وبفضل نظام مراقبة الأداء وتقييم الأداء SPC، تصبح المنتجات أكثر اتساقًا، وتنخفض العيوب، وتسير العمليات بشكل أكثر سلاسة.
التعريف والأهمية
تُطلق الجمعية الأمريكية للجودة (ASQ) على مراقبة العمليات الإحصائية اسم "استخدام الإحصاءات لإدارة عملية ما". تساعد مراقبة العمليات الإحصائية على معرفة سبب اختلاف العمليات. وبعد ذلك، تقوم بإصلاح هذه المشكلات للحفاظ على جودة المنتج وخفض الهدر. على سبيل المثال، قام مصنع سيارات بخفض عيوبه بمقدار 37% في ستة أشهر فقط باستخدام مراقبة العمليات الإحصائية. كما عززت إحدى شركات تصنيع الإلكترونيات إنتاجها بمقدار 22%.
الخلفية التاريخية
بدأ التحكم في العمليات الإحصائية في عشرينيات القرن الماضي مع الدكتور والتر شيهارت في مختبرات بيل. وكانت أفكار الدكتور شيهارت حول قياس التغيرات في العمليات رائدة. وفي وقت لاحق، قامت اليابان بتحسين مراقبة العمليات الإحصائية كثيراً بفضل دبليو إدواردز ديمنج. وبمرور الوقت، أصبحت مراقبة الأداء الفردي أساسية لمراقبة الجودة في جميع أنحاء العالم.
المبادئ الأساسية
تعتبر أساسيات SPC ضرورية لاستخدامه بشكل صحيح. وتشمل الأجزاء الرئيسية ما يلي:
- تحليل التباين في العمليات: معرفة الفرق بين اختلافات العملية العادية وتلك التي تشير إلى وجود مشكلة.
- استقرار العملية: الحفاظ على ثبات الأداء من خلال الفحص والتعديل الدائم.
- التحسين المستمر: استخدام البيانات دائمًا لإيجاد طرق للقيام بالأمور بشكل أفضل وبجودة أعلى.
These ideas make SPC great at keeping quality high. A medical device company saw a 45% lower rate of customer complaints with SPC. And, the packaging sector saved $1.2 million a year.
الفوائد المحققة
| صناعة | نتائج تنفيذ نظام تخطيط البرامج والمشروعات |
|---|---|
| السيارات | 37% انخفاض في معدلات الخلل في معدلات الخلل |
| الإلكترونيات | 22% زيادة في الإنتاجية |
| الأجهزة الطبية | انخفاض 45% في شكاوى العملاء |
| التعبئة والتغليف | $1.2 مليون دولار من الوفورات السنوية |
| التصنيع الآلي الدقيق | تخفيض 62% في الأجزاء غير المطابقة للمواصفات |
| طوارئ المستشفى | 28% انخفاض في متوسط أوقات الانتظار |
| أشباه الموصلات | 18% تحسن في العائد |
دور مخططات التحكم في مراقبة الأداء الفردي في مراقبة الأداء الفردي
تعتبر مخططات التحكم أساسية في التحكم في العمليات الإحصائية (SPC). فهي تعرض البيانات بمرور الوقت. وهذا يساعد في معرفة التغييرات العادية من التغييرات الخاصة. فهي تتبع كيفية أداء العملية، وهو أمر بالغ الأهمية للجودة الجيدة في صنع الأشياء.
أنواع مخططات التحكم
مختلفة مخططات التحكم لأنواع واستخدامات معينة من البيانات:
- المخططات البيانية ذات العمود X والنطاق:: الأفضل لأحجام المجموعات الفرعية من 2 إلى 10. فهي تتحقق من ثبات متوسطات المجموعات الفرعية ضمن حدود التحكم. يتم تعيين هذه الحدود عند ثلاثة انحرافات معيارية عن المتوسط.
- المخططات البيانية X-بار وسيجما:: جيدة للمجموعات الفرعية الأكبر. فهي تعطي رؤية أفضل لكيفية اختلاف العملية.
- المخططات البيانية الفردية X والنطاق المتحرك (IX-MR):: مثالية عندما يكون هناك عنصر واحد فقط في مجموعة فرعية. على سبيل المثال، مشاهدة كل قياس بمفرده.
- المخططات البيانية للمناطق:: تمزج بين سمات مخططات X-bar ومخططات CUSUM. يتم تمييز نقاط البيانات في مناطق الانحراف لإبراز المشكلات.
- مخططات المجموع التراكمي (CUSUM):: فهي رائعة لرؤية التغيرات في المتوسط. ويتم ذلك بجمع الانحرافات مع مرور الوقت.
- الرسوم البيانية:: وسائل عينة الرسم هذه لدراسة مدى تكرار حدوث أنماط البيانات.

تفسير مخططات التحكم البيانية
يساعد فهم مخططات التحكم في معرفة سبب اختلاف الأشياء وإصلاحها بسرعة. تكون حدود التحكم عادةً ثلاثة انحرافات معيارية عن المتوسط. وهذا يفصل بين التغيرات العادية والتغيرات الخاصة. ترشد قواعد ويسترن إلكتريك إلى اكتشاف المشكلات. على سبيل المثال، تُظهر نقطة بيانات خارج حد 3 سيجما أو عدة نقاط بالقرب من خطوط التحكم وجود مشاكل.
التطبيق في مختلف الصناعات
مخططات التحكم مهمة في العديد من المجالات، وليس فقط في صنع الأشياء. في مجال الرعاية الصحية، فهي تتحقق من العمليات للحفاظ على جودة الرعاية. يمكنهم تتبع المدة التي يستغرقها إعطاء الدواء. وهذا يكتشف مشاكل مثل مشاكل المعدات أو عدم وجود عدد كافٍ من الموظفين. في مجال التمويل، تكتشف مخططات التحكم الأشياء الغريبة في المعاملات لوقف الاحتيال.
يتيح استخدام مخططات التحكم في SPC للشركات مراقبة وتحليل العمليات في الوقت الفعلي. وهذا أمر أساسي لتحسين العمليات والحفاظ على معايير الجودة العالية.
خطوات تطبيق نظام مراقبة الأداء الاستراتيجي في مؤسستك

يتضمن وضع SPC في العمل في مؤسستك خطوات دقيقة. وهي تضمن لك أن تؤتي جهودك في مراقبة الأداء الفردي ثمارها حقًا، مما يعزز الجودة والعمل. يتعلق الأمر بجعل الأمور أفضل وأكثر كفاءة بمرور الوقت.
إنشاء طرق القياس
أولاً، تحتاج إلى طرق قياس قوية. فالحصول على بيانات دقيقة ومتسقة هو المفتاح. فهو يساعد على تحليل الأمور بشكل صحيح. استخدم أدوات مثل مخططات السبب والنتيجة والمخططات البيانية والرسوم البيانية لتحديد المشكلات وترتيبها. يساعد ذلك المديرين على فهم المشاكل والتصرف بشكل صحيح.
تأهيل نظام القياس
من الضروري التحقق من صحة قياساتك. يتم ذلك من خلال تحليل نظام القياس الخاص بك. من الطرق الشائعة قياس R&R (قابلية التكرار والتكرار). تؤكد هذه الخطوة ما إذا كانت بياناتك موثوقة ومفيدة لإنشاء مخططات دقيقة لمعايير مراقبة الأداء والتكرار.
جمع البيانات والرسم البياني
يجب أن يكون جمع البيانات بشكل منظم، بحيث تصل إلى جميع أجزاء العملية. بعد ذلك، توضع البيانات على مخططات SPC لمراقبة سلوك العملية. تساعد المخططات البيانية مثل النطاقات المتحركة و x & R في إظهار التباين والإشارة عندما تكون الأمور غير صحيحة. يساعد جمع البيانات وتخطيطها في تحسين العملية والتنبؤ بالنتائج.
وضع خطة رد الفعل
يساعد وضع خطة جاهزة للتصرف استنادًا إلى نتائج مراقبة الأداء الاستراتيجي في اتخاذ قرارات سريعة. تسرد هذه الخطة خطوات عندما لا تسير الأمور كما هو مخطط لها. وغالبًا ما يحتاج إصلاح المشاكل إلى العمل الجماعي، كما أشار الدكتور دبليو إي ديمنج في 94% من المشاكل التي تحتاج إلى جهود مشتركة. فالخطة المحكمة تبقي كل شيء تحت السيطرة والتحسينات مستمرة.
| خطوة العمل | وصف | فوائد |
|---|---|---|
| إنشاء طرق القياس | استخدام أدوات مثل المخططات البيانية ومخططات باريتو لتحديد أولويات المشاكل. | تحسين فهم الاختلافات والبيانات الدقيقة. |
| تأهيل نظام القياس | إجراء تحليل نظام القياس لضمان موثوقية البيانات. | جمع بيانات دقيقة وموثوقة. |
| جمع البيانات والرسم البياني | تجميع البيانات بشكل منهجي واستخدام المخططات البيانية لنظام مراقبة الأداء وتخطيطه. | المراقبة الفعالة والتنبؤ بنتائج العملية. |
| وضع خطة رد الفعل | وضع خطة للتدخلات في الوقت المناسب استنادًا إلى تحليلات SPC. | تحكم معزز وتحسينات مستدامة. |
يساعد التقدم من خلال مراقبة الأداء الاستراتيجي بهذه الإجراءات المخطط لها على بناء ثقافة التحسين المستمر. فهو يجمع بين العاملين...
لقد قرأت 57% من المقال. الباقي لمجتمعنا هل أنت عضو بالفعل؟ تسجيل الدخول
(وأيضًا لحماية المحتوى الأصلي لدينا من روبوتات الكشط)
مجتمع الابتكار العالمي
تسجيل الدخول أو التسجيل (100% مجاناً)
اطلع على بقية هذه المقالة وجميع المحتويات والأدوات الخاصة بالأعضاء فقط.
فقط المهندسون والمصنعون والمصممون والمسوقون الحقيقيون المحترفون.
لا روبوت، ولا كاره، ولا مرسل رسائل غير مرغوب فيها.
القراءات والطرق ذات الصلة
- Total Quality Management (TQM): يركز على التحسين المستمر وإرضاء العملاء من خلال التحسينات المنهجية للعمليات.
- تصميم التجارب (DOE): طريقة إحصائية لتخطيط الاختبارات المضبوطة وإجرائها وتحليلها لتقييم العوامل التي تؤثر على نتائج العملية.
- الإنتاج في الوقت المحدد (JIT): استراتيجية لزيادة الكفاءة وتقليل الهدر من خلال استلام السلع فقط عند الحاجة إليها في عملية الإنتاج.
- تخطيط العمليات: تمثيل مرئي لعملية ما لتحديد مجالات التحسين وتبسيط سير العمل.
التعليمات
ما هو التحكم في العمليات الإحصائية (SPC)؟
مراقبة الأداء الفردي هي طريقة لتحسين جودة المنتجات. وهي تستخدم الإحصائيات لمراقبة وتعزيز مدى اتساق العمليات. تتحقق هذه الطريقة من جودة الإنتاج في الوقت الفعلي.
ما أهمية مراقبة الأداء الفردي في مراقبة الجودة؟
يعتبر SPC أمرًا أساسيًا للحفاظ على فحوصات الجودة الصارمة في مختلف المجالات. فهو يساعد على تحديد التغييرات الطبيعية في العمليات. وهذا يؤدي إلى عمليات ثابتة ومنتجات أفضل، مما يجعل العمليات أكثر كفاءة.
ما هي مخططات التحكم في SPC؟
مخططات التحكم هي أدوات أساسية في مراقبة الأداء والتخطيط الاستراتيجي. فهي تعرض بيانات العملية بمرور الوقت، وتسلط الضوء على التغييرات العادية وغير العادية. هناك مخططات مختلفة مثل X-bar و R لمختلف احتياجات البيانات.
كيف تساعد مخططات التحكم في تحليل تغيرات العملية؟
تكتشف مخططات التحكم المشكلات في وقت مبكر من خلال إظهار الاختلافات الخارجة عن القاعدة. وهذا يسمح بإصلاحات سريعة. يصبح الحفاظ على استقرار العمليات وتحسين الجودة أسهل.
ما هي خطوات تطبيق نظام مراقبة الأداء الاستراتيجي في المؤسسة؟
للبدء في مراقبة الأداء وتخطيط البرامج، تحتاج الشركات إلى طرق قياس جيدة ويجب عليها تقييمها بدقة. ويجب أن تجمع البيانات بشكل منهجي وأن تستخدم مخططات مراقبة الأداء الفردي بشكل فعال. ومن الضروري وضع خطة عمل متينة تستند إلى نتائج مراقبة الأداء الفردي من أجل اتخاذ الإجراءات في الوقت المناسب.
ما هي التحديات الشائعة عند تطبيق نظام مراقبة الأداء الاستراتيجي، وكيف يمكن التغلب عليها؟
تشمل المشاكل سوء فهم البيانات وسوء معايرة المعدات. وغالبًا ما تكون هناك أيضًا معارضة للأساليب الجديدة. يتطلب حل هذه المشكلات تدريبًا شاملاً وفحصًا متكررًا للنظام وتواصلًا واضحًا حول فوائد مراقبة الأداء الفردي.
ما هي مزايا تطبيق مراقبة الأداء الفردي في عمليات التصنيع؟
يقلل استخدام مراقبة الأداء الفردي في التصنيع من تقلب العمليات ويعزز الإنتاجية. يقلل من التكاليف ويجعل العملاء أكثر سعادة. يمكن للشركات أن تتكيف بشكل استباقي لتحقيق جودة أفضل، مما يمنحها ميزة تنافسية.
كيف يساهم نظام مراقبة الأداء الفردي في تحسين العمليات في الصناعات خارج قطاع التصنيع؟
مراقبة الأداء الفردي ليست فقط للتصنيع. فتركيزه على البيانات والاستقرار والتحسين المستمر يعمل في مجال الرعاية الصحية والمالية أيضًا. فهو يحسن مراقبة الجودة وتحديث العمليات في مختلف القطاعات.
روابط خارجية حول مراقبة العمليات الإحصائية للجودة
المعايير الدولية
(حرك الرابط لرؤية وصفنا للمحتوى)
مسرد المصطلحات المستخدمة
Design of Experiment (DOE): طريقة منهجية لتخطيط وإجراء وتحليل الاختبارات الخاضعة للرقابة لتقييم تأثيرات المتغيرات المتعددة على متغير الاستجابة، مما يسهل تحديد الظروف المثلى والتفاعلات بين العوامل.
Just In Time (JIT): استراتيجية إنتاج تهدف إلى تقليل تكاليف المخزون من خلال استلام البضائع فقط عند الحاجة إليها في عملية التصنيع، وبالتالي تقليل النفايات وزيادة الكفاءة.
Measurement System Analysis (MSA): طريقة إحصائية تستخدم لتقييم دقة وموثوقية عمليات وأدوات القياس، والتأكد من أن البيانات التي تم جمعها صالحة ومتسقة لاتخاذ القرارات في مراقبة الجودة وتحسين العمليات.
Repeatability and Reproducibility (R&R): قدرة نظام القياس على إنتاج نتائج متسقة في ظل نفس الظروف (التكرار) وعبر ظروف أو مشغلين مختلفين (إمكانية إعادة الإنتاج)، والتي يتم تقييمها غالبًا من خلال الأساليب الإحصائية لتقييم التباين والموثوقية في عمليات جمع البيانات.
Statistical Process Control (SPC): طريقة لمراقبة الجودة تستخدم تقنيات إحصائية لمراقبة عملية ما والتحكم فيها، والتأكد من أنها تعمل بكامل إمكاناتها من خلال تحديد الاختلافات والحفاظ على الناتج المتسق ضمن حدود محددة.
Total quality management (TQM): نهج إداري يركز على النجاح على المدى الطويل من خلال إرضاء العملاء، وإشراك جميع أعضاء المنظمة في التحسين المستمر للعمليات والمنتجات والخدمات لتعزيز الجودة والأداء.


قراءة مثيرة للاهتمام! لكن ألا تعتقد أن تخطيط البرامج والميزانية قد يعرقل الابتكار من خلال التركيز المفرط على الاتساق؟ دعنا نتناقش.
مقالة رائعة
كيف يمكن تطبيق نظام مراقبة الأداء الفردي في الصناعات الخدمية خارج نطاق التصنيع، مثل التمويل أو الرعاية الصحية؟
كيف يمكن للتكنولوجيا أن تبسط تنفيذ وتحليل مراقبة الأداء الاستراتيجي؟
قراءة مثيرة للاهتمام، ولكن أليست هناك بدائل أبسط من SPC لمراقبة الجودة؟ تبدو معقدة بالنسبة للشركات الصغيرة، أليس كذلك؟
في حين أن الخلفية التاريخية كانت مفيدة، كيف يمكن للمرء أن يطبق نظام مراقبة الأداء بفعالية في بيئة إنتاج في الوقت الفعلي؟
تعتبر مراقبة الأداء الفردي (نوعًا ما) عالمية. فهو ليس خاصًا بالصناعة، ولكنه خاص بالطريقة.