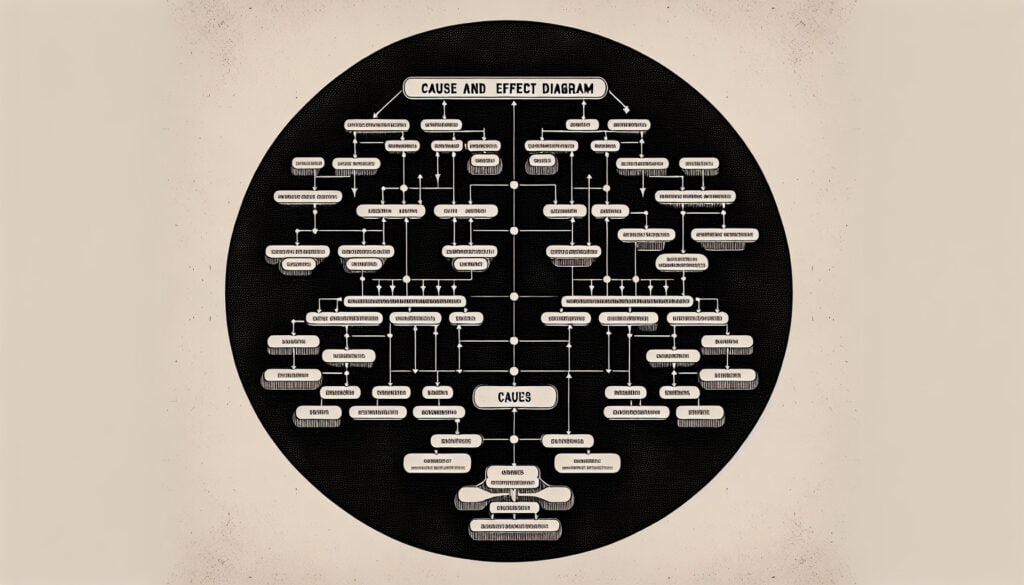
The Cause and Effect Diagram, commonly referred to as a Fishbone Diagram, finds significant applications across various industries, including manufacturing, healthcare, and software development, particularly during project phases focused on root cause analysis and quality improvement. This methodology is utilized during problem-solving sessions to identify and categorize potential causes of a specific issue, where team members from diverse disciplines—such as engineering, design, operations, and quality assurance—collaborate to populate the diagram. In product design, for instance, teams may dissect issues related to product defects by examining categories like materials, processes, and personnel skills, encouraging participants to think broadly within these structured frameworks. In healthcare, use of this diagram can reveal underlying factors contributing to patient care challenges, allowing organizations to enhance service delivery through targeted interventions. Furthermore, through the visual clarity the diagram provides, stakeholders can better communicate findings, prioritize root causes for investigation, and devise comprehensive strategies to tackle complex problems effectively. It is particularly valuable in lean management initiatives where organizations aim to eliminate waste and improve processes, thus fostering a
continuous improvement culture that engages all employees in problem-solving activities.