브레인스토밍, 지속적인 개선, 고장 모드 및 영향 분석(FMEA), 문제 해결 기법, 프로세스 개선, 품질 관리, 품질 관리, 근본 원인 분석
목적:
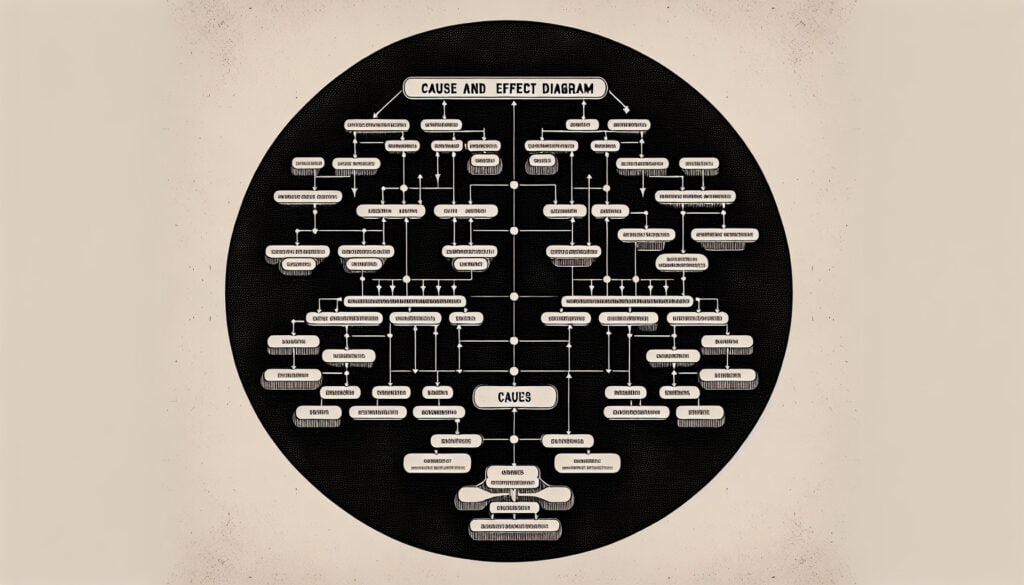
특정 문제 또는 결과의 잠재적 원인을 탐색하고 분류하는 데 사용되는 시각적 도구입니다. 피시본 다이어그램 또는 이시카와 다이어그램이라고도 합니다.
사용 방법:
문제(결과)는 물고기의 '머리' 부분에 명시되고, 잠재적 원인의 주요 범주(예: 사람, 프로세스, 장비)는 '뼈' 부분으로 그려지며, 각 범주에 대해 구체적인 원인을 브레인스토밍합니다.
장점
잠재적인 근본 원인을 체계적으로 도출하는 방법을 제공하고, 표준 범주를 사용하여 폭넓은 사고를 장려하며, 문제에 대한 명확한 시각적 표현을 만들어냅니다.
단점
매우 복잡하고 혼란스러워질 수 있으며, 그 자체로 해결책을 제시하거나 원인의 우선순위를 정해주지 않고, 파악된 원인들은 입증된 것이 아니라 잠재적인 원인일 뿐입니다.
카테고리:
린 시그마, 조작, 문제 해결, 품질
다음과 같은 경우에 가장 적합합니다:
문제의 잠재적 근본 원인을 체계적으로 브레인스토밍하고 분류합니다.
The Cause and Effect Diagram, commonly referred to as a Fishbone Diagram, finds significant applications across various industries, including manufacturing, healthcare, and software development, particularly during project phases focused on root cause analysis and quality improvement. This methodology is utilized during problem-solving sessions to identify and categorize potential causes of a specific issue, where team members from diverse disciplines—such as engineering, design, operations, and quality assurance—collaborate to populate the diagram. In product design, for instance, teams may dissect issues related to product defects by examining categories like materials, processes, and personnel skills, encouraging participants to think broadly within these structured frameworks. In healthcare, use of this diagram can reveal underlying factors contributing to patient care challenges, allowing organizations to enhance service delivery through targeted interventions. Furthermore, through the visual clarity the diagram provides, stakeholders can better communicate findings, prioritize root causes for investigation, and devise comprehensive strategies to tackle complex problems effectively. It is particularly valuable in lean management initiatives where organizations aim to eliminate waste and improve processes, thus fostering a continuous improvement culture that engages all employees in problem-solving activities.
이 방법론의 주요 단계
도표 맨 위에 문제점을 파악하고 명확하게 기술하십시오.
잠재적 원인의 주요 범주(예: 사람, 프로세스, 장비 및 환경)를 파악하십시오.
각 주요 범주에 대한 가지를 그려서 다이어그램의 '뼈대'를 만드세요.
주요 범주별로 구체적인 원인을 생각해 보세요.
팀원들이 아이디어를 제시하도록 장려하여 잠재적 원인 목록을 포괄적으로 작성하십시오.
구체적인 원인 목록을 정리하고 다듬어 유사한 아이디어들을 함께 묶으세요.
원인을 분석하고 추가 조사 또는 조치가 필요한지 우선순위를 정하십시오.
프로 팁
다양한 분야의 팀원들을 참여시켜 다양한 통찰력과 전문 지식을 확보함으로써 잠재적인 모든 원인을 파악할 가능성을 높이십시오.
정량적 데이터를 활용하여 파악된 원인들을 영향력과 발생 가능성을 기준으로 우선순위를 정하고, 가장 시급한 문제에 집중하십시오.
피드백 세션을 통해 다이어그램을 반복적으로 검토하고 개선하여 근본 원인 분석 과정의 명확성과 협업을 강화합니다.