Downdetector compared with StatusGator, IsItDownRightNow and UptimeRobot| ダウンディテクター | StatusGator | IsItDownRightNow | UptimeRobot |
|---|
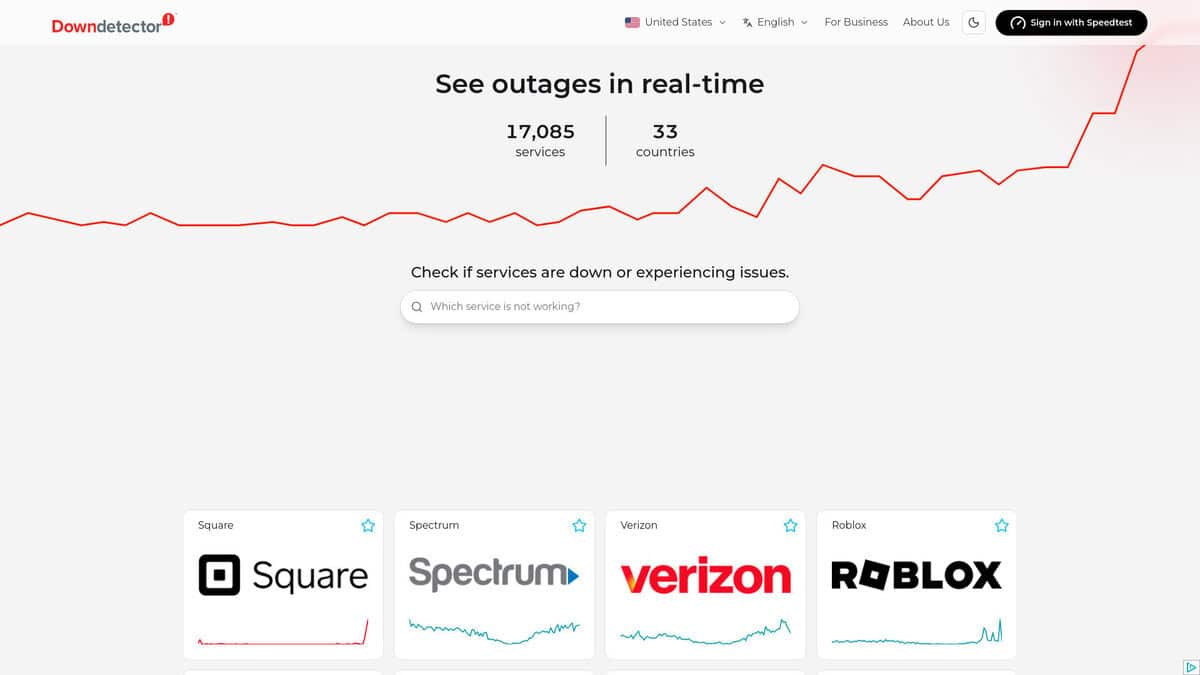
| Signal source: The signal is made of outage reports submitted by users from per-service pages, shown as a time chart with a map of report origin. It shows user perception of a problem, not an automated measurement. | Signal source: It collects the official status pages of cloud and SaaS vendors and displays them in one dashboard. A change appears when the vendor reports downtime on its own status page. | Signal source: A third-party review states that it runs automated checks itself and does not use user reports. It sends HTTP or HTTPS requests and sometimes ICMP ping and reads the response code. | Signal source: It runs automated checks against the endpoints that you configure, so it measures your own services and not third-party platforms. Free monitor types include HTTP(S), port, ping, keyword, API, UDP, DNS and dependency checks. |
| カバレッジ: It reports on more than 12,000 services in 45 countries, each country having its own site, according to the Wikipedia article. Typical subjects are ISPs, platforms and consumer services. | カバレッジ: It tracks more than 4,000 cloud service providers and lets you follow individual components or regions as separate services. It can also monitor websites. | カバレッジ: It checks a single website address on demand. A review notes that it tests from limited locations, so regional outages can be missed. | カバレッジ: Coverage is limited to the monitors you create. The free plan allows up to 50 monitors with a 5-minute check interval, and paid plans shorten the interval. |
| Limits of the signal: A spike in reports does not always mean an outage, and small services can generate noise. For critical systems it should be compared with the provider status page. | Limits of the signal: It depends on what the vendor chooses to publish, so an incident not yet acknowledged by the vendor is not visible, although the product advertises early warning notifications. | Limits of the signal: It checks only whether the server responds. It cannot detect database problems, broken JavaScript, API failures or login issues, and free checks offer little history. | Limits of the signal: It sees only the paths and locations from which it probes, and its results are as good as the checks you define. The free plan keeps data for 3 months. |
| Alerts and automation: The page provides charts and user comments that often identify the failing component. No scripting interface is described in the sources checked. | Alerts and automation: Features include API access, webhooks, integrations such as PagerDuty, historical CSV export, public status pages and single sign-on. | Alerts and automation: The review describes a quick manual check and recommends confirming results with other tools. It does not describe alerting. | Alerts and automation: Alerts cover slow responses and SSL and domain expiry. Paid plans add webhook, Zapier and PagerDuty integrations and public status pages on your own domain. |
| コストモデル: A free plan is available, and paid tiers add features. | | コストモデル: A free plan is available, with paid plans offering faster checks, more status pages and longer data retention. Enterprise terms include an SLA and compliance support. |