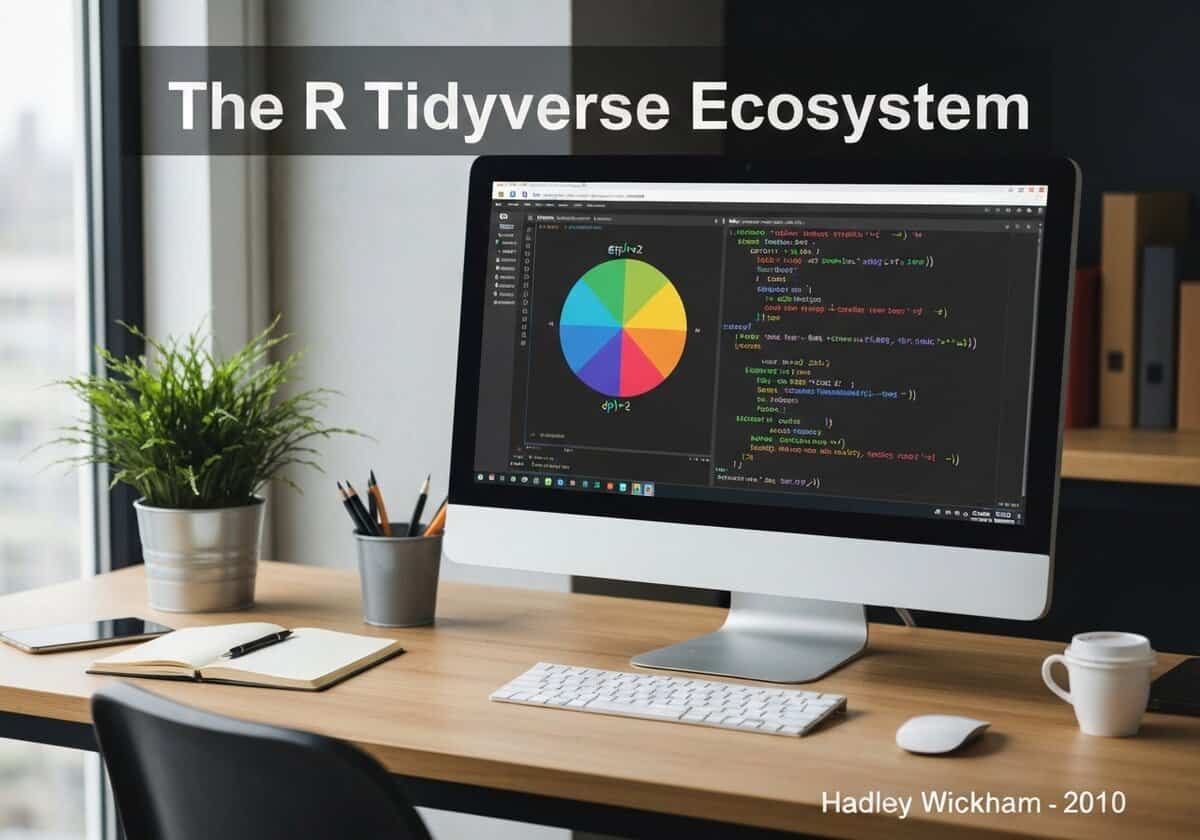
The R Tidyverse Ecosystem
The Tidyverse is a collection of R packages designed for data science that share an underlying design philosophy, grammar, and data structures. Developed by Hadley Wickham and others, it provides a consistent and powerful toolkit for data import, tidying, transformation, visualization, and modeling. Key packages include `ggplot2`, `dplyr`, `tidyr`, and `readr`, which compose together using pipes.
The Tidyverse is an opinionated ecosystem of R packages that has profoundly influenced modern data analysis in R. It is built on the concept of “tidy data,” a standard way of organizing data where each variable is a column, each observation is a row, and each type of observational unit is a table. This consistent data structure allows for the creation of tools that compose together elegantly.
The core philosophy of the Tidyverse is to make data analysis more human-readable and intuitive. This is achieved through consistent function and argument names and the extensive use of the pipe operator (`%>%` or `|>`), which allows for chaining operations together in a sequence that reads like a sentence (e.g., `data %>% filter(…) %>% group_by(…) %>% summarize(…)`). Key packages provide specialized tools: `dplyr` for data manipulation, `ggplot2` for declarative data visualization based on the “Grammar of Graphics,” `tidyr` for tidying data, `readr` for fast data import, and `purrr` for functional programming. While sometimes criticized for being a separate “dialect” of R, the Tidyverse has become a de facto standard for many data scientists due to its efficiency and expressive power.
UNESCO Nomenclature: 1203
– Computer science
Precursors
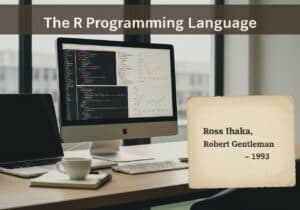
- The R programming language itself
- The concept of a ‘Grammar of Graphics’ by Leland Wilkinson
- The pipe operator concept from Unix shells and other programming languages
- Functional programming principles
- The data frame structure in R
Applications
- data cleaning and preparation for machine learning
- creating complex, publication-quality data visualizations with ggplot2
- interactive data exploration and analysis in R notebooks
- building reproducible data analysis pipelines
- teaching data science concepts with a consistent and intuitive syntax
Potential Innovations Ideas
Due to scrapping bot traffic, currently more than 40k per day, this content is reserved to community members.
> Login < or > Register < (100% free) to access this, so as all other restricted content and tools.
Related to: Tidyverse, R, data science, ggplot2, dplyr, Hadley Wickham, tidy data, data visualization, data manipulation, pipe operator.