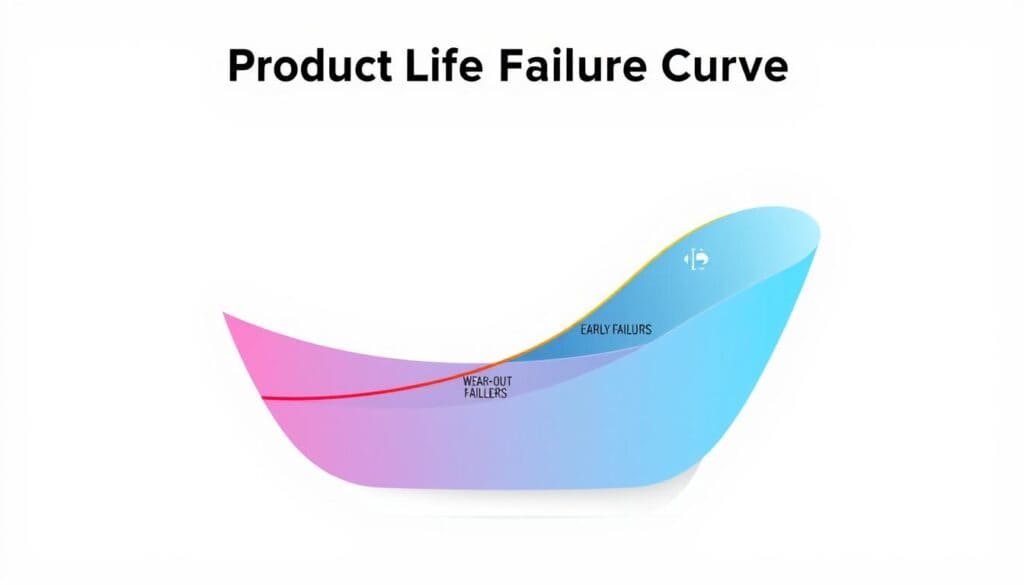
Have you heard about the famed failure rate shown by the bathtub curve? It highlights key phases in a product’s دورة الحياة. The product life failure curve is crucial in reliability modeling. It shows how products fail over time through three main stages. These stages are Infant Mortality, Normal Life, and Wear-Out. This curve isn’t just theory. It’s a practical tool for industries to reduce risks and make their products last longer.
The “Infant Mortality” phase starts with a high failure rate. This is due to issues like manufacturing defects or flawed designs. After this, there’s the “Normal Life” period where failure rates level off. This shows the product working well during its main use phase. But, as time goes on, products enter the “Wear-Out” phase. Here, failures spike because of wear and tear.
Understanding the product life failure curve has many practical uses. It’s key for predictive maintenance. This knowledge lets reliability engineers fix problems before they get worse. With this insight, companies can improve their products’ quality, safety, and lifespan. This leads to happier customers and lower running costs.
النقاط الرئيسية
- The product life failure curve visualizes the lifespan failures of products in three distinct phases: Infant Mortality, Normal Life, and Wear-Out.
- High failure rates in the initial stage are often due to manufacturing defects or design flaws.
- The “Normal Life” period showcases a consistent and low failure rate, attributed to random, less frequent failures.
- In the “Wear-Out” phase, the failure rate surges as components deteriorate or degrade over time.
- Implementing predictive maintenance strategies can effectively preempt failures, particularly during the wear-out stage.
The Three Stages of the Bathtub Curve
The bathtub curve is a tool used in systems engineering. It shows the failure rate of a product over time. This curve has three main parts: the Infant Mortality Period, the Normal Life Period, and the Wear-Out Period. Knowing these phases helps improve product reliability.
Infant Mortality Period
The first stage is the Infant Mortality Period. It starts right after a product is launched. This stage has a high failure rate. The causes are manufacturing defects, design flaws, or installation errors. To lower these failures, strict quality control and early testing are key.
Normal Life Period
Then comes the Normal Life Period. The failure rate is lower and stable here. Failures happen randomly and are due to wear, use changes, or human mistakes. Regular maintenance and monitoring help keep failures low.
Wear-Out Period
The last stage is the Wear-Out Period. The product’s failure rate goes up as it gets older. Parts wear out with long use. It’s often cheaper to replace or upgrade the product than to keep fixing it. Planning for this phase helps manage a product’s life better.
Below is a summary of the three stages:
| منصة | صفات | Failure Rate | Key Causes |
|---|---|---|---|
| Infant Mortality Period | High failure rate soon after deployment | Decreasing | Defects in materials, design flaws, installation issues |
| Normal Life Period | Stable, low failure rate | Constant | Wear, human errors, variations in usage |
| Wear-Out Period | Increasing failure rate as product deteriorates | Increasing | Component aging, prolonged usage |
Importance of Product Life Failure Curve in Reliability Engineering
ال product life failure curve, especially the bathtub curve, is key in reliability engineering. It helps experts predict how systems will perform over time. They use this info to make important decisions on maintenance, what resources to use, and how to avoid problems.
Knowing a product’s life stage is crucial. It helps decide what action to take next. In the infant mortality stage, the focus is on fixing bugs and testing. Skipping preventive maintenance here could cause more issues.
في normal life period, using preventative maintenance keeps things running smoothly and prevents downtime. In the wear-out period, fixing problems becomes more important. That’s because things start to fail more often.
To analyze life data, experts use different methods. These include probability plotting and various regression techniques. The Weibull distribution is a common choice for this analysis. It comes in several forms depending on the data and needed insights.
| Life Data Analysis Methods | Common Distributions | Parameter Estimation | Results |
|---|---|---|---|
| Probability Plotting | ويبول | Probability Plotting | Reliability Given Time |
| Rank Regression on X (RRX) | Exponential | Rank Regression on X (RRX) | Probability of Failure Given Time |
| Rank Regression on Y (RRY) | Lognormal | Rank Regression on Y (RRY) | Mean Life (MTTF or MTBF) |
| Maximum Likelihood Estimation (MLE) | Normal | Maximum Likelihood Estimation (MLE) | Failure Rate |
Maintenance management strategies approaches combines sensors with digital tools for better asset management. The product life failure curve helps organizations cut costs while improving performance. It does this through good failure prediction and making smart choices ahead of time.
Utilizing the Product Life Failure Curve for Predictive Maintenance
Adding the Product Life Failure Curve to predictive maintenance plans offers great value for managing reliability. Often called the Bathtub Curve, it shows three key stages of a product’s life. Knowing which stage a product is in helps plan maintenance, avoid sudden failures, and extend equipment life. These insights are essential for timely maintenance and lowering downtime.
Maintenance focus grows during the Wear-Out Period. This is because product failures are more likely then. Through condition-based monitoring and analyzing real-time data, companies can understand an asset’s health. Using the Bathtub Curve for predictive analytics helps plan maintenance ahead of time. This avoids expensive shutdowns, makes resource use efficient, lowers maintenance costs, and keeps equipment reliable.
The P-F curve is key in predictive maintenance, showing the time between Potential Failure (P) and Functional Failure (F). This helps find early wear and prevent total failure. Methods like analyzing lubricants, studying vibrations, and trending process parameters expand the P-F interval and boost maintenance. Regular updates of this curve, with the help of maintenance software and tracking, enhance reliability strategies. They also improve efficiency and extend asset life.
قراءات وأساليب تكميلية
Reliability Engineering: Techniques for improving product reliability and extending lifespan.
Preventive Maintenance Strategies: Methods for scheduling and implementing maintenance to prevent failures.
تحليل أنماط الفشل وتأثيراتها (تحليل الوضع والتأثير والتأثير): Systematic approach for identifying potential failure modes and their impact.
Root Cause Analysis (RCA): Techniques for identifying the underlying causes of product failures.
Total Quality Management (TQM): Comprehensive approach to improving product quality and performance.
- Design for Reliability (DfR): Strategies for integrating reliability into the product design process.
- التحكم الإحصائي في العمليات (SPC): Use of statistical methods to monitor and control production processes.
- Lifecycle Cost Analysis (تحليل دورة الحياة): Evaluation of the total cost of ownership throughout the دورة حياة المنتج.
- Accelerated Life Testing (ALT): Methods for simulating and analyzing product life under extreme conditions.
Condition Monitoring and Predictive Maintenance: Technologies and techniques for monitoring product condition and predicting failures before they occur.
التعليمات
What is the Product Life Failure Curve?
The Product Life Failure Curve is shown by the Bathtub Curve. It’s a key tool in reliability engineering. It shows how a product’s failure rate changes over time. This highlights when failures happen due to making defects, use, or aging.
How is the Bathtub Curve structured?
The Bathtub Curve shows three key phases: Infant Mortality, Normal Life, and Wear-Out. Each phase has its own failure rate and causes. This helps with maintenance strategies and reliability plans.
What occurs during the Infant Mortality Period?
During the Infant Mortality Period, failures are high but decrease over time. This decrease comes as defects get fixed. Issues here usually come from bad materials, design mistakes, and installation errors.
How is the Normal Life Period different?
The Normal Life Period features a steady, low failure rate. It’s marked by consistent use with little failure. It’s the best time for preventive maintenance to keep things running smoothly.
What defines the Wear-Out Period?
The Wear-Out Period sees more failures because parts get old. Predictive maintenance is key here. It helps manage the risk of failures. Doing so optimizes repairs and replacements.
Why is the Bathtub Curve important for failure prediction?
The Bathtub Curve is key for predicting failures. It shows where a product is in its life. Knowing this helps plan maintenance or fix issues early. This reduces downtime and costs.
What are the benefits of using the Product Life Failure Curve in predictive maintenance?
The Curve helps in predictive maintenance by scheduling it just right. It helps avoid unexpected failures and extends equipment life. It also makes maintenance more efficient. This boosts reliability and keeps assets running.
External Links on Product Reliability and Legal Warranty
المعايير الدولية
(حرك الرابط لرؤية وصفنا للمحتوى)
مسرد المصطلحات المستخدمة
Design for Reliability (DfR): نهج منهجي لتطوير المنتجات يركز على الموثوقية طوال عملية التصميم، ويتضمن تقنيات لتحديد وتخفيف أوضاع الفشل المحتملة، وضمان الأداء المتسق وطول العمر في البيئات التشغيلية.
Failure Mode and Effects Analysis (FMEA): طريقة منهجية لتقييم أوضاع الفشل المحتملة داخل النظام أو العملية أو المنتج، وتقييم آثارها على الأداء، وإعطاء الأولوية للمخاطر لتحسين الموثوقية والسلامة من خلال الإجراءات التصحيحية.
Life Cycle Assessment (LCA): تحليل منهجي للتأثيرات البيئية المرتبطة بجميع مراحل حياة المنتج، من استخراج المواد الخام إلى الإنتاج والاستخدام والتخلص منها، بهدف تحديد فرص التحسين وإبلاغ عملية صنع القرار.
Maximum Likelihood Estimation (MLE): هي طريقة إحصائية لتقدير معلمات التوزيع الاحتمالي عن طريق تعظيم دالة الاحتمال، التي تقيس مدى جودة تفسير النموذج للبيانات المرصودة. وتحدد هذه الطريقة قيم المعلمات التي تجعل البيانات المرصودة أكثر احتمالاً في ظل النموذج المفترض.
Mean Time Between Failures (MTBF): متوسط الوقت المنقضي بين الأعطال المتتالية لنظام أو مكون أثناء التشغيل، ويُقاس عادةً بالساعات. ويُستخدم كمقياس للموثوقية لتقييم أداء المعدات واحتياجات صيانتها.
Root Cause Analysis (RCA): عملية منهجية لتحديد العوامل الأساسية التي تؤدي إلى مشكلة أو فشل، بهدف معالجة المشكلات الأساسية والقضاء عليها بدلاً من مجرد معالجة الأعراض.
Statistical Process Control (SPC): طريقة لمراقبة الجودة تستخدم تقنيات إحصائية لمراقبة عملية ما والتحكم فيها، والتأكد من أنها تعمل بكامل إمكاناتها من خلال تحديد الاختلافات والحفاظ على الناتج المتسق ضمن حدود محددة.
Total Cost of Ownership (TCO): تقدير مالي يحسب جميع التكاليف المباشرة وغير المباشرة المرتبطة باقتناء وتشغيل وصيانة أصل ما طوال دورة حياته بالكامل، بما في ذلك سعر الشراء والتركيب والصيانة والتدريب وتكاليف التخلص.
Total quality management (TQM): نهج إداري يركز على النجاح على المدى الطويل من خلال إرضاء العملاء، وإشراك جميع أعضاء المنظمة في التحسين المستمر للعمليات والمنتجات والخدمات لتعزيز الجودة والأداء.