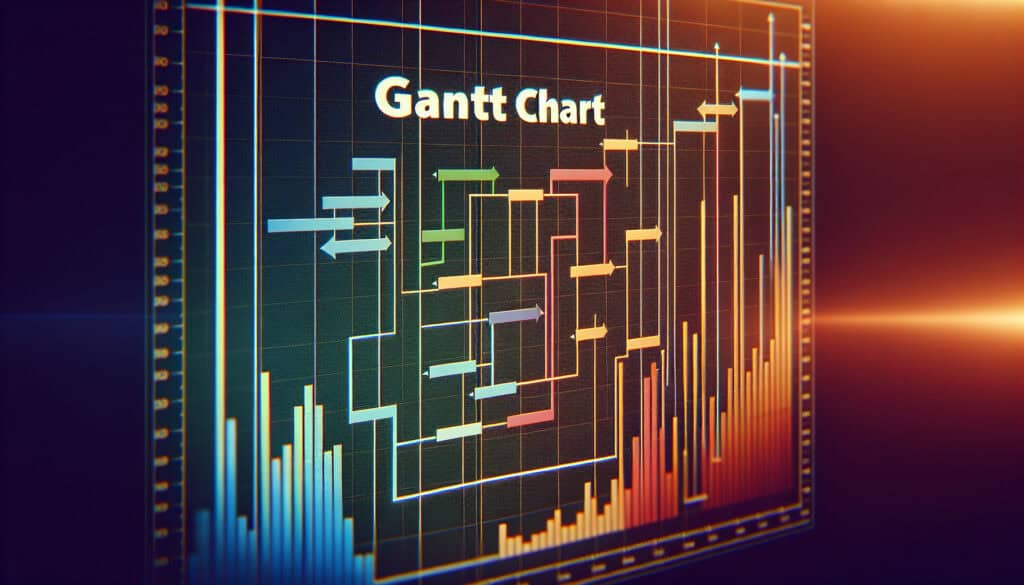
Provides a clear visual representation of a project schedule; Helps to identify task dependencies and the critical path.
缺点
大型项目可能会变得复杂且难以管理;如果不定期更新,可能会产生误导。
类别
项目管理
最适合:
规划和安排包含多个任务和相互依赖关系的复杂项目。
Gantt charts serve as effective tools for visualizing project timelines, particularly in industries such as construction, software development, and research and development, where multiple interconnected tasks are common. These charts are particularly valuable during the planning and execution phases of projects, enabling project managers and teams to break down large projects into manageable tasks. Stakeholders can easily identify when tasks overlap and map out their interdependencies, allowing for better resource allocation and time management. Various software solutions, including Microsoft Project and Asana, facilitate the creation of Gantt charts, making it easier for teams to maintain updated schedules and track progress against initial timelines. An example can be seen in the construction industry, where Gantt charts help manage the various phases of building a structure, ensuring that critical tasks, such as foundation pouring and framing, are completed in the correct order to avoid delays. This methodology encourages collaboration among team members, as everyone involved can see the project’s status at a glance and understand their role within the larger framework. When properly utilized, Gantt charts can significantly enhance communication among stakeholders and team members, as they provide a common reference point throughout the project’s life cycle.
该方法的关键步骤
根据项目范围定义项目任务和里程碑。
确定每项任务的持续时间和资源分配。
建立任务依赖关系以确定活动顺序。
将任务与日历对应起来,创建时间线。
确定关键路径,突出直接影响项目工期的任务。
为每项任务分配职责和资源。
定期更新甘特图,以反映项目变更和进展。
在项目生命周期中,分析和利用甘特图进行决策和调整。
专业提示
Incorporate milestone markers in your Gantt Chart to delineate significant project phases, as this enhances progress tracking and aids in stakeholder communication.