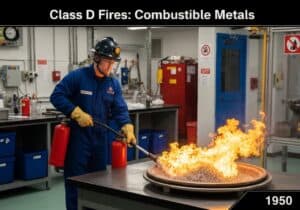
Product Design, Manufacturing & Innovation Resources

간트 차트

간트 차트

간트 차트

목적:

프로젝트 일정을 시각화하는 프로젝트 관리 도구입니다.

사용 방법:

장점

단점

카테고리:

다음과 같은 경우에 가장 적합합니다:

Gantt charts serve as effective tools for visualizing project timelines, particularly in industries such as construction, software development, and research and development, where multiple interconnected tasks are common. These charts are particularly valuable during the planning and execution phases of projects, enabling project managers and teams to break down large projects into manageable tasks. Stakeholders can easily identify when tasks overlap and map out their interdependencies, allowing for better resource allocation and time management. Various software solutions, including Microsoft Project and Asana, facilitate the creation of Gantt charts, making it easier for teams to maintain updated schedules and track progress against initial timelines. An example can be seen in the construction industry, where Gantt charts help manage the various phases of building a structure, ensuring that critical tasks, such as foundation pouring and framing, are completed in the correct order to avoid delays. This methodology encourages collaboration among team members, as everyone involved can see the project’s status at a glance and understand their role within the larger framework. When properly utilized, Gantt charts can significantly enhance communication among stakeholders and team members, as they provide a common reference point throughout the project’s life cycle.

이 방법론의 주요 단계

  1. 프로젝트 범위에 따라 프로젝트 작업과 마일스톤을 정의합니다.
  2. 각 작업에 대한 작업 기간과 자원 할당량을 결정합니다.
  3. 작업 간 의존 관계를 설정하여 활동 순서를 파악합니다.
  4. 달력에 맞춰 작업을 표시하여 타임라인을 만드세요.
  5. 프로젝트 기간에 직접적인 영향을 미치는 작업을 파악하기 위해 핵심 경로를 식별하십시오.
  6. 각 작업에 책임과 자원을 할당하십시오.
  7. 프로젝트 변경 사항 및 진행 상황을 반영하여 간트 차트를 정기적으로 업데이트하십시오.
  8. 프로젝트 수명 주기 동안 의사 결정 및 조정을 위해 간트 차트를 분석하고 활용합니다.

프로 팁

  • Incorporate milestone markers in your Gantt Chart to delineate significant project phases, as this enhances progress tracking and aids in stakeholder communication.
  • 프로젝트 일정의 변동 사항을 반영하여 간트 차트를 정기적으로 업데이트하고, 현재 상태를 정확하게 나타내어 역동적인 의사 결정을 지원하십시오.
  • 프로젝트 내에서 자원 배분 및 작업 담당자를 시각적으로 빠르게 파악할 수 있도록 다양한 작업 범주 또는 팀에 색상 코드를 활용하세요.

여러 방법론을 읽고 비교하기 위해, 저희는 다음을 추천합니다

> 광범위한 방법론 저장소  <
400가지가 넘는 다른 방법론들과 함께.

이 방법론에 대한 의견이나 추가 정보는 언제든지 환영합니다. 아래 댓글란 ↓ , 엔지니어링 관련 아이디어나 링크도 마찬가지입니다.

역사적 맥락

1950
1955
1956
1960
1960
1960
1960
1950
1950
1955
1958
1960
1960
1960
1960

(날짜를 알 수 없거나 관련이 없는 경우, 예를 들어 "유체역학"의 경우, 주목할 만한 등장 시기를 대략적으로 추정하여 제공합니다.)

고화질 이미지 및 다운로드는 등록된 회원에게만 100% 무료로 제공됩니다.

> 로그인 <