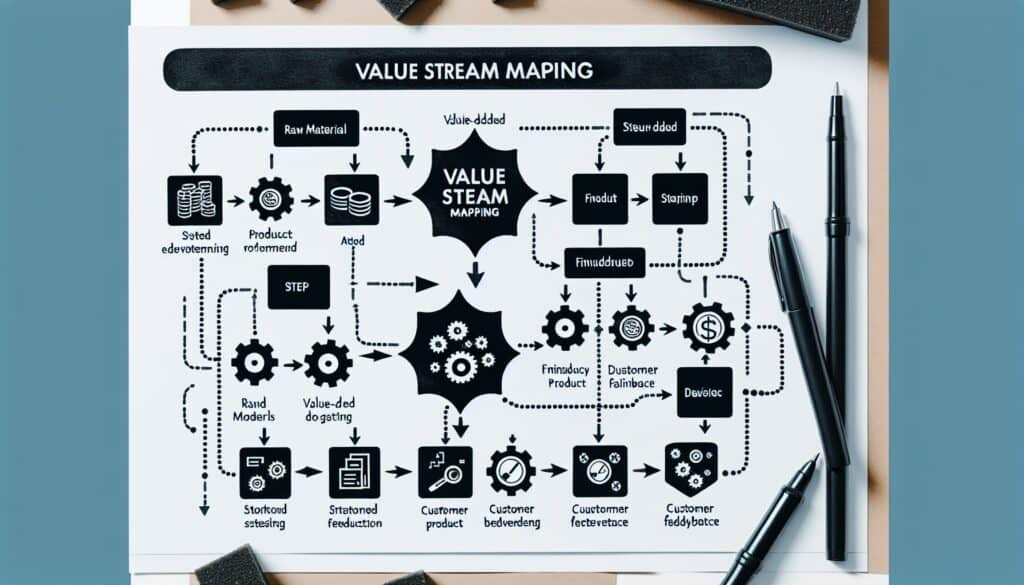
Value Stream Mapping (VSM) serves as a powerful methodology across various sectors such as manufacturing, healthcare, and software development, where understanding the flow of value is paramount. In manufacturing, for example, automotive companies utilize VSM to visualize workshop processes, enabling them to pinpoint inefficiencies between assembly lines and material handling systems. In healthcare, hospitals apply VSM to optimize patient flow, thereby enhancing service delivery while minimizing waiting times. This methodology is particularly effective in the initial phases of a project where mapping current operations can yield significant improvements. Participants typically include cross-functional teams comprising engineers, operators, and stakeholders who contribute diverse perspectives on process challenges and opportunities. Conducting regular workshops or Kaizen events can invigorate this practice, encouraging continuous updates to both current and future state maps as processes evolve. A hallmark of VSM is its visual nature, which not only simplifies complex workflows but also promotes enhanced communication among team members, fostering a shared understanding of goals and metrics that drive performance improvements. Exporting VSM findings into action plans sets a structured path for change, leading to measurable reductions in cycle times and increases in customer satisfaction. The collaborative approach reinforces a culture of continuous improvement, supporting organizations in their pursuit of lean principles while establishing a framework for sustainable operational excellence.