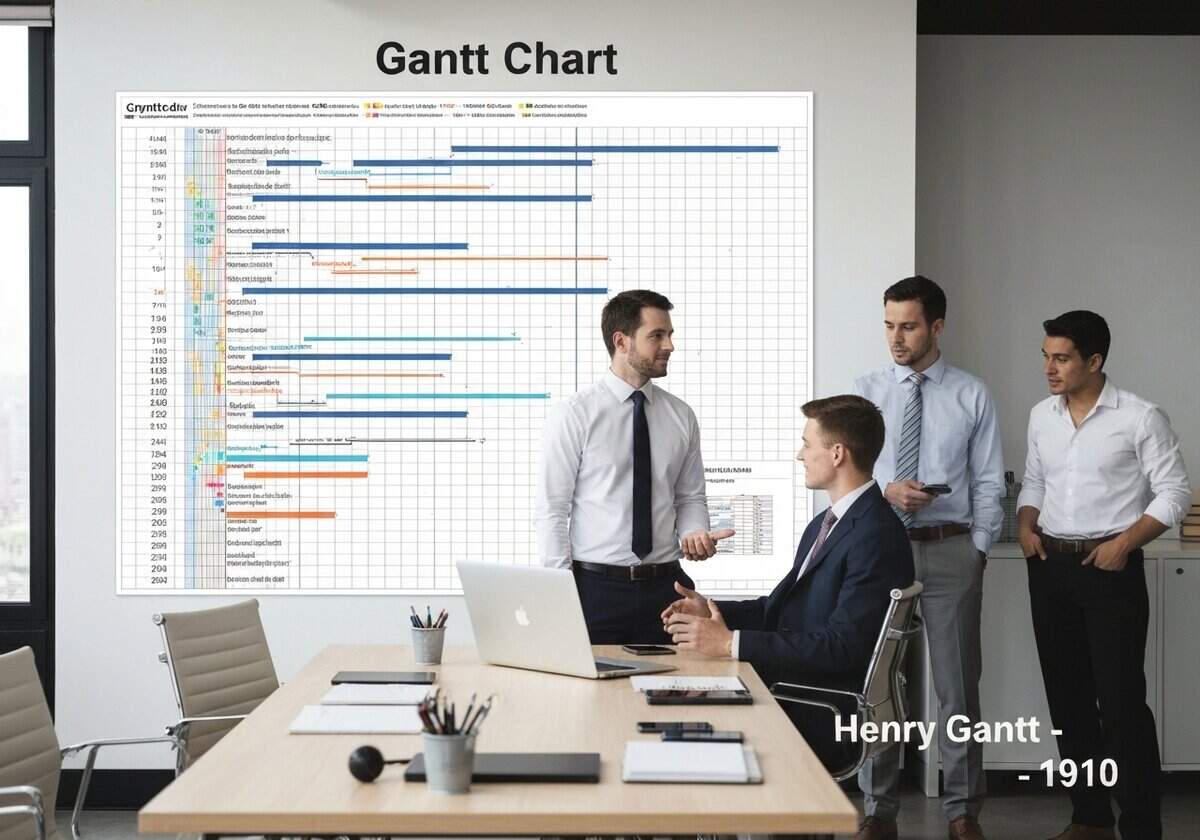
The Gantt chart is a bar chart that illustrates a project schedule. It lists tasks vertically and time intervals horizontally. Horizontal bars show the start and finish dates of the project elements, along with their duration. The chart visualizes dependencies between tasks and tracks the current schedule status, showing what percentage of each task is complete.
The Gantt chart, conceived by Henry Gantt around 1910-1915, was a revolutionary tool that departed from abstract lists of tasks. Its primary novelty was the visual representation of time against activity. This graphical display made project schedules intuitive and accessible to managers and workers alike, a significant improvement over previous tabular methods. To construct a Gantt chart, one first lists all necessary tasks on the vertical axis. The horizontal axis represents time, broken down into suitable increments like days, weeks, or months. For each task, a horizontal bar is drawn from its start date to its end date, visually representing its duration and placement in the overall timeline.
Modern Gantt charts have evolved significantly. They often include milestone markers for important deadlines, dependency lines (e.g., finish-to-start links) showing relationships between tasks, and color-coding for different task types or resource assignments. A key feature is progress tracking, often shown by shading a portion of a task’s bar to represent the percentage of work completed. While highly effective for visualizing schedules, traditional Gantt charts have limitations. They can become cluttered and difficult to read for highly complex projects with hundreds of tasks. They also do not inherently display the ‘critical path’—the sequence of tasks that determines the project’s total duration—without being combined with techniques like PERT or CPM. Despite this, the Gantt chart remains a cornerstone of project management, with its principles integrated into virtually all modern project management 软件 like Microsoft Project, Asana, and Trello.