A project management tool for visualizing a project schedule.
- Metodologie: Ingegneria, Qualità
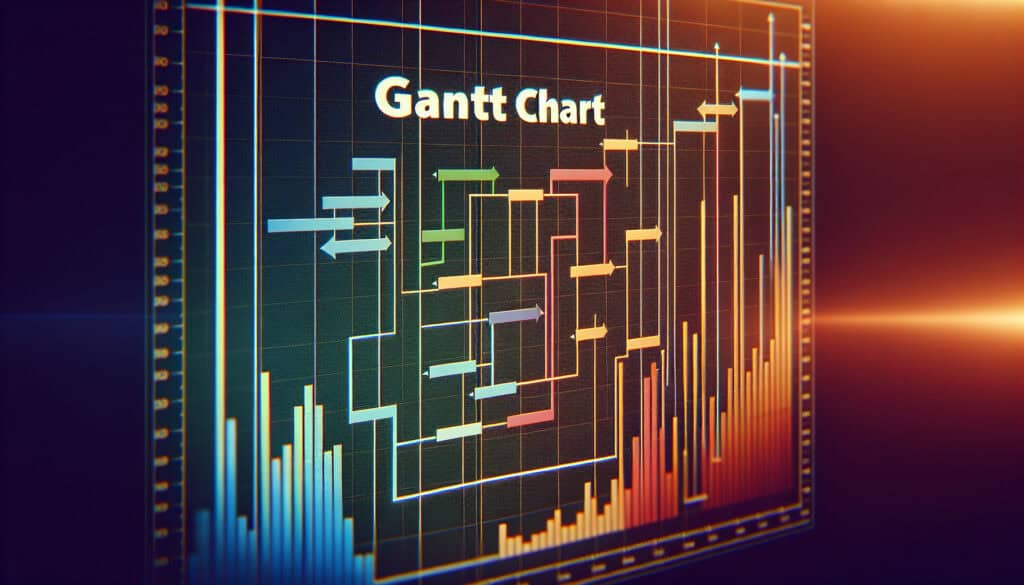
Gantt Chart
Gantt Chart
- Metodologia agile, Miglioramento continuo, Pensiero progettuale, Miglioramento dei processi, Gestione del progetto, Gestione della qualità, Gestione del rischio, Lavoro di squadra, Mappatura del flusso di valore
Obiettivo:
Come si usa:
- A bar chart that illustrates a project schedule, showing the start and finish dates of the terminal elements and summary elements of a project. It is used to plan, schedule, and track the progress of a project.
Professionisti
- Provides a clear visual representation of a project schedule; Helps to identify task dependencies and the critical path.
Contro
- Can become complex and difficult to manage for large projects; Can be misleading if not updated regularly.
Categorie:
- Gestione del progetto
Ideale per:
- Planning and scheduling a complex project with multiple tasks and dependencies.
Gantt charts serve as effective tools for visualizing project timelines, particularly in industries such as construction, software development, and research and development, where multiple interconnected tasks are common. These charts are particularly valuable during the planning and execution phases of projects, enabling project managers and teams to break down large projects into manageable tasks. Stakeholders can easily identify when tasks overlap and map out their interdependencies, allowing for better resource allocation and time management. Various software solutions, including Microsoft Project and Asana, facilitate the creation of Gantt charts, making it easier for teams to maintain updated schedules and track progress against initial timelines. An example can be seen in the construction industry, where Gantt charts help manage the various phases of building a structure, ensuring that critical tasks, such as foundation pouring and framing, are completed in the correct order to avoid delays. This methodology encourages collaboration among team members, as everyone involved can see the project’s status at a glance and understand their role within the larger framework. When properly utilized, Gantt charts can significantly enhance communication among stakeholders and team members, as they provide a common reference point throughout the project’s ciclo vitale.
Fasi chiave di questa metodologia
- Define project tasks and milestones based on project scope.
- Determine task durations and resource allocations for each task.
- Establish task dependencies to identify sequences of activities.
- Create a timeline by plotting tasks against a calendar.
- Identify the critical path to highlight tasks that directly impact the project duration.
- Assign responsibilities and resources to each task.
- Regularly update the Gantt chart to reflect project changes and progress.
- Analyze and utilize the Gantt chart for decision-making and adjustments during the project lifecycle.
Suggerimenti per i professionisti
- Incorporate milestone markers in your Gantt Chart to delineate significant project phases, as this enhances progress tracking and aids in stakeholder communication.
- Regularly update the Gantt Chart to reflect variations in the project timeline, ensuring that it accurately represents current statuses, which aids in dynamic decision-making.
- Utilize color-coding for different task categories or teams, as this facilitates quick visual identification of resource allocation and task ownership within the project.
Leggere e confrontare diverse metodologie, raccomandiamo il
> Ampio archivio di metodologie <
insieme ad altre 400 metodologie.
I vostri commenti su questa metodologia o ulteriori informazioni sono benvenuti su sezione commenti qui sotto ↓ , così come tutte le idee o i link relativi all'ingegneria.
Contesto storico


1949
1950
1950
1960
1960
1960
1960
1940
1950
1950
1958
1960
1960
1960
1960


(se la data non è nota o non è rilevante, ad esempio "meccanica dei fluidi", viene fornita una stima approssimativa della sua notevole comparsa)
Post correlati
Programma di produzione principale (MPS)
Personalizzazione di massa
Imbuto di marketing
Audit di marketing
Indice MAPO (Movimento e assistenza dei pazienti in ospedale)
Pianificazione delle risorse di produzione (MRP II)