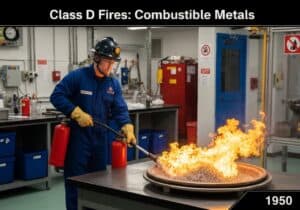
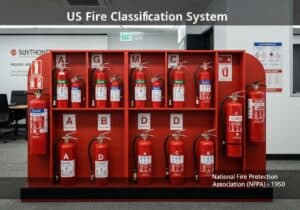
Product Design, Manufacturing & Innovation Resources

Gantt Chart

Gantt Chart

Gantt Chart

उद्देश्य:

परियोजना अनुसूची को देखने के लिए एक परियोजना प्रबंधन उपकरण।

इसका उपयोग कैसे किया जाता है:

फायदे

नुकसान

श्रेणियाँ:

इसके लिए सबसे अच्छा:

Gantt charts serve as effective tools for visualizing project timelines, particularly in industries such as construction, software development, and research and development, where multiple interconnected tasks are common. These charts are particularly valuable during the planning and execution phases of projects, enabling project managers and teams to break down large projects into manageable tasks. Stakeholders can easily identify when tasks overlap and map out their interdependencies, allowing for better resource allocation and time management. Various software solutions, including Microsoft Project and Asana, facilitate the creation of Gantt charts, making it easier for teams to maintain updated schedules and track progress against initial timelines. An example can be seen in the construction industry, where Gantt charts help manage the various phases of building a structure, ensuring that critical tasks, such as foundation pouring and framing, are completed in the correct order to avoid delays. This methodology encourages collaboration among team members, as everyone involved can see the project’s status at a glance and understand their role within the larger framework. When properly utilized, Gantt charts can significantly enhance communication among stakeholders and team members, as they provide a common reference point throughout the project’s life cycle.

इस पद्धति के प्रमुख चरण

  1. परियोजना के दायरे के आधार पर परियोजना कार्यों और लक्ष्यों को परिभाषित करें।
  2. प्रत्येक कार्य के लिए कार्य अवधि और संसाधन आवंटन निर्धारित करें।
  3. गतिविधियों के क्रम को पहचानने के लिए कार्यों की निर्भरता स्थापित करें।
  4. एक कैलेंडर के अनुसार कार्यों को सूचीबद्ध करके एक समयरेखा बनाएं।
  5. परियोजना की अवधि पर सीधा प्रभाव डालने वाले कार्यों को उजागर करने के लिए महत्वपूर्ण मार्ग की पहचान करें।
  6. प्रत्येक कार्य के लिए जिम्मेदारियां और संसाधन आवंटित करें।
  7. परियोजना में होने वाले परिवर्तनों और प्रगति को दर्शाने के लिए गैंट चार्ट को नियमित रूप से अपडेट करें।
  8. परियोजना जीवनचक्र के दौरान निर्णय लेने और समायोजन करने के लिए गैंट चार्ट का विश्लेषण और उपयोग करें।

प्रो टिप्स

  • Incorporate milestone markers in your Gantt Chart to delineate significant project phases, as this enhances progress tracking and aids in stakeholder communication.
  • परियोजना की समयरेखा में होने वाले बदलावों को दर्शाने के लिए गैंट चार्ट को नियमित रूप से अपडेट करें, यह सुनिश्चित करते हुए कि यह वर्तमान स्थितियों को सटीक रूप से प्रस्तुत करता है, जो गतिशील निर्णय लेने में सहायक होता है।
  • विभिन्न कार्य श्रेणियों या टीमों के लिए रंग-कोडिंग का उपयोग करें, क्योंकि इससे परियोजना के भीतर संसाधन आवंटन और कार्य स्वामित्व की त्वरित दृश्य पहचान में सुविधा होती है।

विभिन्न पद्धतियों को पढ़ने और उनकी तुलना करने के लिए, हम अनुशंसा करते हैं

> व्यापक कार्यप्रणाली भंडार  <
अन्य 400 से अधिक पद्धतियों के साथ।

इस कार्यप्रणाली पर आपकी टिप्पणियाँ या अतिरिक्त जानकारी का स्वागत है। नीचे टिप्पणी अनुभाग देखें ↓ , साथ ही इंजीनियरिंग से संबंधित कोई भी विचार या लिंक।

ऐतिहासिक संदर्भ

1950
1955
1956
1960
1960
1960
1960
1950
1950
1955
1958
1960
1960
1960
1960

(यदि तिथि अज्ञात है या प्रासंगिक नहीं है, उदाहरण के लिए "द्रव यांत्रिकी", तो इसके उल्लेखनीय उद्भव का एक अनुमानित आंकड़ा प्रदान किया गया है)

संबंधित पोस्ट

पंजीकृत सदस्यों के लिए पूर्ण आकार की छवियाँ और डाउनलोड 100% निःशुल्क उपलब्ध हैं।