A project management tool for visualizing a project schedule.
- 方法: 精益西格玛, 制造业
Gantt Chart
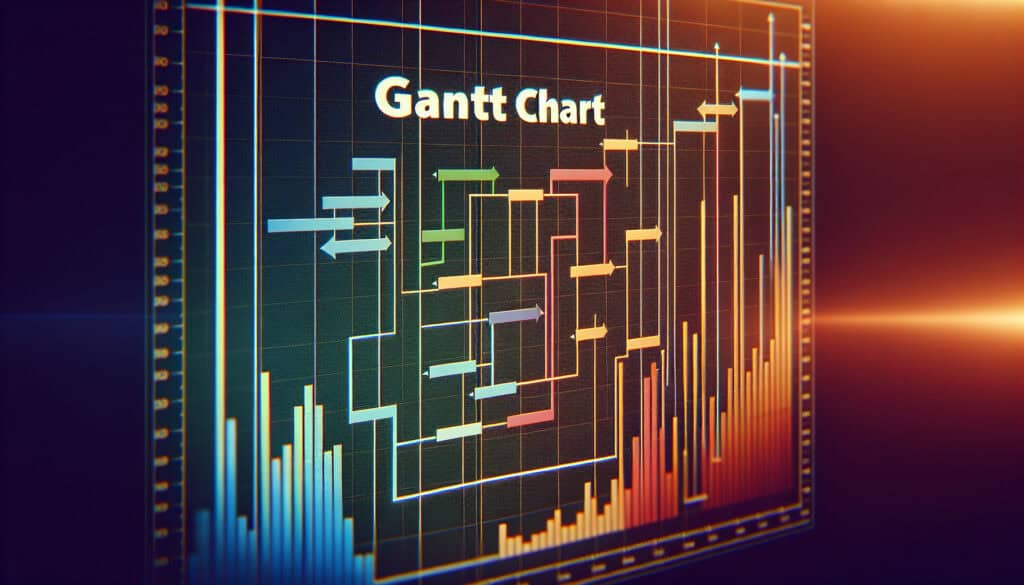
Gantt Chart
- 敏捷方法论, 持续改进, 设计思维, 流程改进, 项目管理, 质量管理, 风险管理, 团队合作, 价值流映射
目标
如何使用
- A bar chart that illustrates a project schedule, showing the start and finish dates of the terminal elements and summary elements of a project. It is used to plan, schedule, and track the progress of a project.
优点
- Provides a clear visual representation of a project schedule; Helps to identify task dependencies and the critical path.
缺点
- Can become complex and difficult to manage for large projects; Can be misleading if not updated regularly.
类别
- 项目管理
最适合:
- Planning and scheduling a complex project with multiple tasks and dependencies.
Gantt charts serve as effective tools for visualizing project timelines, particularly in industries such as construction, software development, and research and development, where multiple interconnected tasks are common. These charts are particularly valuable during the planning and execution phases of projects, enabling project managers and teams to break down large projects into manageable tasks. Stakeholders can easily identify when tasks overlap and map out their interdependencies, allowing for better resource allocation and time management. Various software solutions, including Microsoft Project and Asana, facilitate the creation of Gantt charts, making it easier for teams to maintain updated schedules and track progress against initial timelines. An example can be seen in the construction industry, where Gantt charts help manage the various phases of building a structure, ensuring that critical tasks, such as foundation pouring and framing, are completed in the correct order to avoid delays. This methodology encourages collaboration among team members, as everyone involved can see the project’s status at a glance and understand their role within the larger framework. When properly utilized, Gantt charts can significantly enhance communication among stakeholders and team members, as they provide a common reference point throughout the project’s 生命周期.
该方法的关键步骤
- Define project tasks and milestones based on project scope.
- Determine task durations and resource allocations for each task.
- Establish task dependencies to identify sequences of activities.
- Create a timeline by plotting tasks against a calendar.
- Identify the critical path to highlight tasks that directly impact the project duration.
- Assign responsibilities and resources to each task.
- Regularly update the Gantt chart to reflect project changes and progress.
- Analyze and utilize the Gantt chart for decision-making and adjustments during the project lifecycle.
专业提示
- Incorporate milestone markers in your Gantt Chart to delineate significant project phases, as this enhances progress tracking and aids in stakeholder communication.
- Regularly update the Gantt Chart to reflect variations in the project timeline, ensuring that it accurately represents current statuses, which aids in dynamic decision-making.
- Utilize color-coding for different task categories or teams, as this facilitates quick visual identification of resource allocation and task ownership within the project.
历史背景


1949
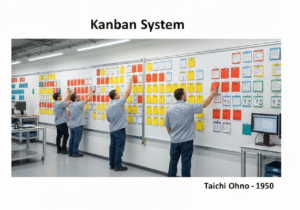
1950
1950
1960
1960
1960
1960
1940
1950
1950
1958
1960
1960
1960
1960


(如果日期不详或不相关,例如 "流体力学",则对其显著出现的时间作了四舍五入的估计)。
相关文章
制造运营管理(MOM)
制造执行系统(MES)
生产控制计划
人工测试
手动搬运评估表 (MAC)
手动任务风险评估工具(ManTRA)