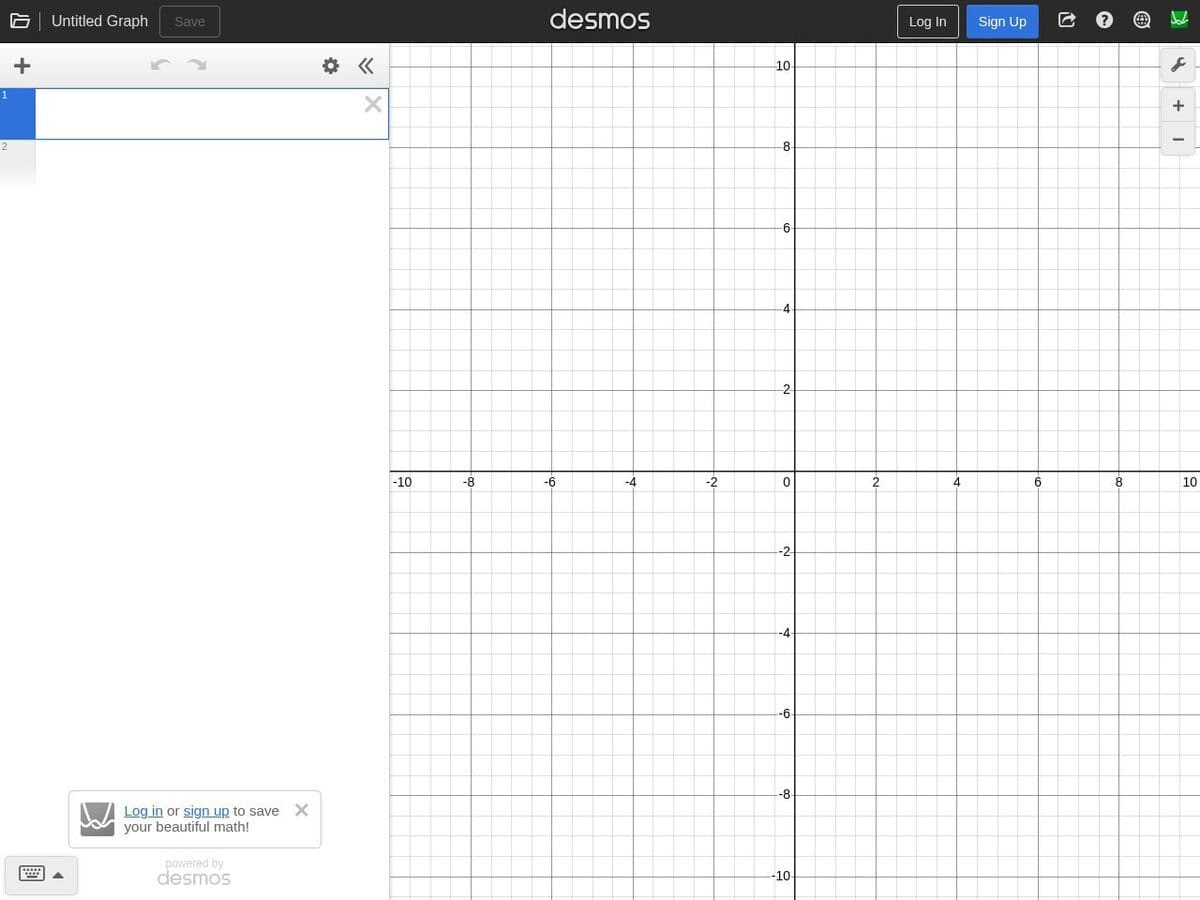
Your formula to 2D plots instantly: high-performance computational engine designed for real-time mathematical visualization and symbolic manipulation. It facilitates the plotting of explicit, implicit, polar, and parametric equations while providing dynamic parameter control through interactive sliders. The platform supports complex data analysis, including multi-variable regressions and list-based operations, allowing users to derive functional models from raw datasets. Core technical capabilities include:
- Numerical integration and differentiation for calculus-based modeling.
- High-resolution rendering of inequalities for defining operational boundaries.
- API-driven integration for embedding interactive simulations in technical documentation.
- Cloud-based synchronization for collaborative model development and version control.
Nice plots, permits to manage several formulas at the same time.
Tip: there is also a 3D plot version the the site.
In engineering and manufacturing, professionals utilize this service for rapid sensitivity analysis and the validation of design constraints. Engineers apply the tool to visualize stress-strain curves and fluid dynamics parameters, enabling quick iterations before moving to finite element analysis. Quality control specialists leverage the regression engine to monitor production variances and optimize tolerance levels through statistical modeling.