To visualize the physical flow of people, materials, or information within a workspace or process to identify and reduce wasted motion and transportation.
- Methodologies: Engineering, Quality
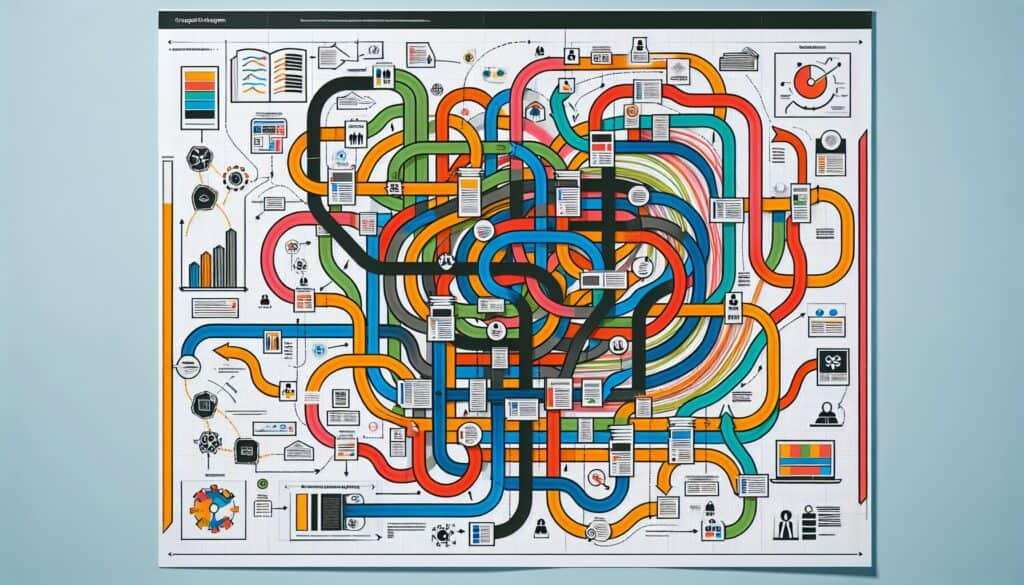
Spaghetti Diagram
Spaghetti Diagram
- Continuous Improvement, Design for Sustainability, Efficiency, Ergonomics, Lean Manufacturing, Process Improvement, Process Mapping, Value Stream Mapping, Waste Reduction
Objective:
How it’s used:
- A continuous line drawing on a floor plan or process map that traces the path of an item or person. The resulting web of lines (resembling spaghetti) highlights inefficiencies like excessive travel distances, backtracking, and unnecessary movements.
Pros
- Simple and visual way to identify wasted motion; Facilitates communication about process inefficiencies; Helps in designing more efficient layouts; Engages employees in process improvement.
Cons
- Can be time-consuming to create for complex processes or multiple items/people; Primarily focuses on physical movement, may not capture other types of waste; Accuracy depends on careful observation.
Categories:
- Ergonomics, Lean Sigma, Manufacturing, Problem Solving
Best for:
- Identifying and eliminating wasted movement and transportation by visually mapping the path taken by products, materials, or people.
Spaghetti Diagrams are particularly useful in various sectors, such as manufacturing, healthcare, and logistics, where the physical movement of items or personnel is frequent and critical. In manufacturing settings, these diagrams can ensure that assembly lines are designed to minimize the distance traveled by workers and materials, thus enhancing production efficiency. In healthcare, analyzing patient and staff movements through facility spaces can lead to improved layouts that promote better patient care and reduce wait times. During the project planning phase, team members including engineers, project managers, and process improvement specialists can collaborate to create these diagrams, using tools like floor plans or process maps to visualize current workflows. This iterative approach not only identifies bottlenecks and redundancies but also encourages staff to participate actively by sharing their insights on day-to-day operations, which can lead to a sense of ownership over the process improvements. Historically, companies such as Toyota have effectively utilized Spaghetti Diagrams as part of Lean methodologies to eliminate waste, demonstrating the practical application within Lean Six Sigma frameworks. Adopting this methodology can also be advantageous when exploring new facility designs, as it provides a baseline for measuring the effects of any changes made.
Key steps of this methodology
- Select the area to be analyzed and obtain an accurate floor plan or process map.
- Trace the actual path taken by the item or person within the area.
- Use a continuous line to represent movements, ensuring clarity of the drawn path.
- Look for areas with excessive movement, backtracking, or unnecessary interactions.
- Identify specific locations where processes can be streamlined or redesigned.
- Engage with stakeholders to discuss observed patterns and seek collaborative solutions.
- Consider alternative layouts or processes to minimize wasted motion.
- Implement changes and monitor their effectiveness through further analysis.
Pro Tips
- Incorporate quantitative metrics alongside the spaghetti diagram to correlate movement efficiencies with performance objectives, providing a data-driven perspective.
- Conduct team workshops to collaboratively create and analyze the spaghetti diagram, ensuring diverse viewpoints contribute to identifying inefficiencies.
- Iterate the layout design based on findings from the spaghetti diagram, using simulation tools to visualize changes before implementation, fostering better decision-making.
To read and compare several methodologies, we recommend the
> Extensive Methodologies Repository <
together with the 400+ other methodologies.
Your comments on this methodology or additional info are welcome on the comment section below ↓ , so as any engineering-related ideas or links.
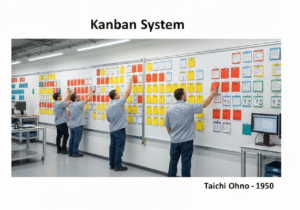
Historical Context
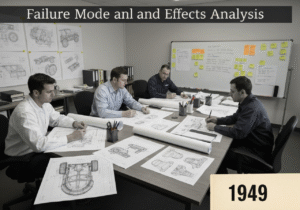


1949
1950
1950
1960
1960
1960
1960
1940
1950
1950
1958
1960
1960
1960
1960


(if date is unknown or not relevant, e.g. "fluid mechanics", a rounded estimation of its notable emergence is provided)
Related Posts
METS to Calories Calculator
Meta-Analysis
Message Mapping
Mental Model Diagrams
Maximum Acceptable Pushing and Pulling Forces
Material Requirements Planning (MRP)