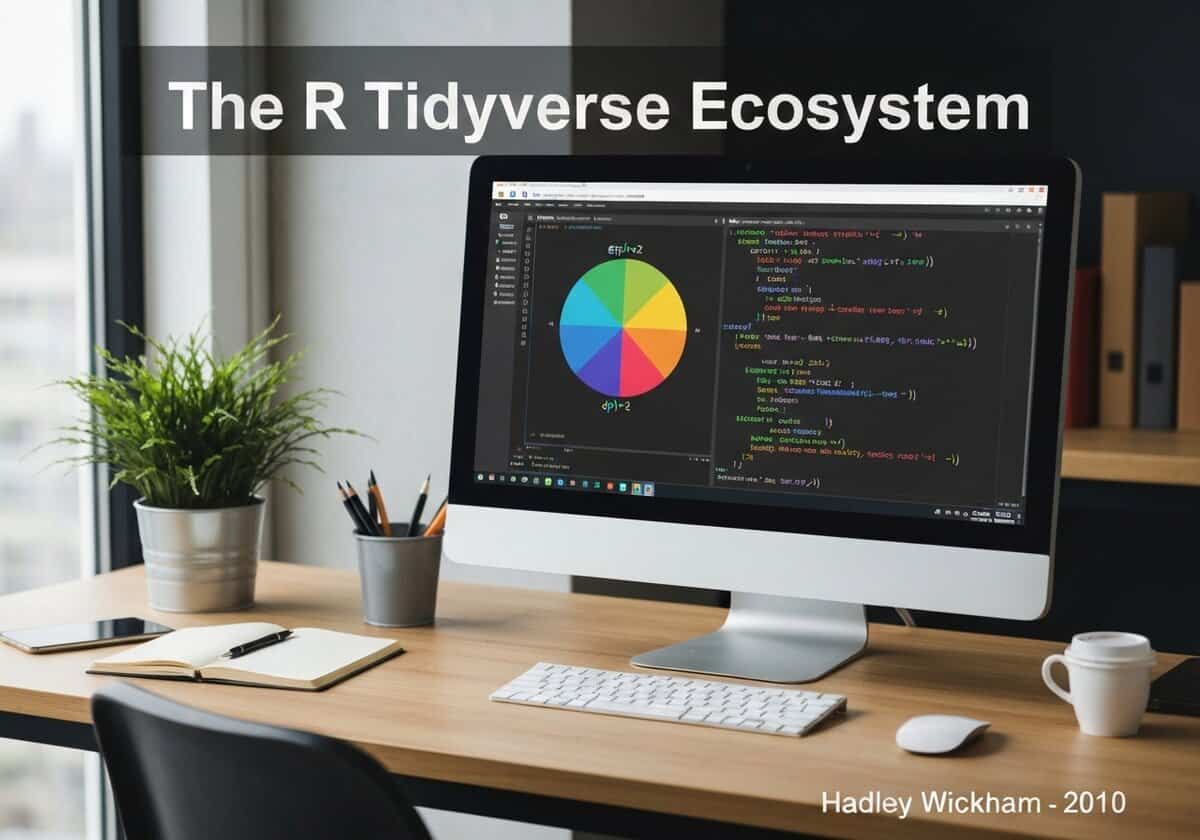
Tidyverseは、データサイエンス向けに設計されたRパッケージの集合体であり、共通の設計思想、文法、データ構造を共有しています。Hadley Wickham氏らが開発したこのパッケージ群は、データのインポート、整理、変換、可視化、モデリングのための、一貫性のある強力なツールキットを提供します。主要なパッケージには、`ggplot2`、`dplyr`、`tidyr`、`readr`などがあり、これらはパイプを使って連携して動作します。


(画像はイメージです)
Tidyverseは、データサイエンス向けに設計されたRパッケージの集合体であり、共通の設計思想、文法、データ構造を共有しています。Hadley Wickham氏らが開発したこのパッケージ群は、データのインポート、整理、変換、可視化、モデリングのための、一貫性のある強力なツールキットを提供します。主要なパッケージには、`ggplot2`、`dplyr`、`tidyr`、`readr`などがあり、これらはパイプを使って連携して動作します。

The Tidyverse is an opinionated ecosystem of R packages that has profoundly influenced modern data analysis in R. It is built on the concept of “tidy data,” a standard way of organizing data where each variable is a column, each observation is a row, and each type of observational unit is a table. This consistent data structure allows for the creation of tools that compose together elegantly.
The core philosophy of the Tidyverse is to make data analysis more human-readable and intuitive. This is achieved through consistent function and argument names and the extensive use of the pipe operator (`%>%` or `|>`), which allows for chaining operations together in a sequence that reads like a sentence (e.g., `data %>% filter(…) %>% group_by(…) %>% summarize(…)`). Key packages provide specialized tools: `dplyr` for data manipulation, `ggplot2` for declarative data visualization based on the “Grammar of Graphics,” `tidyr` for tidying data, `readr` for fast data import, and `purrr` for functional programming. While sometimes criticized for being a separate “dialect” of R, the Tidyverse has become a de facto standard for many data scientists due to its efficiency and expressive power.
R Tidyverseエコシステム
(日付が不明または関連性がない場合、例えば「流体力学」などでは、その注目すべき出現時期の概算値が提示されます。)

フルサイズの画像とダウンロードは、登録会員のみが100%無料で利用できます。
> ログイン <