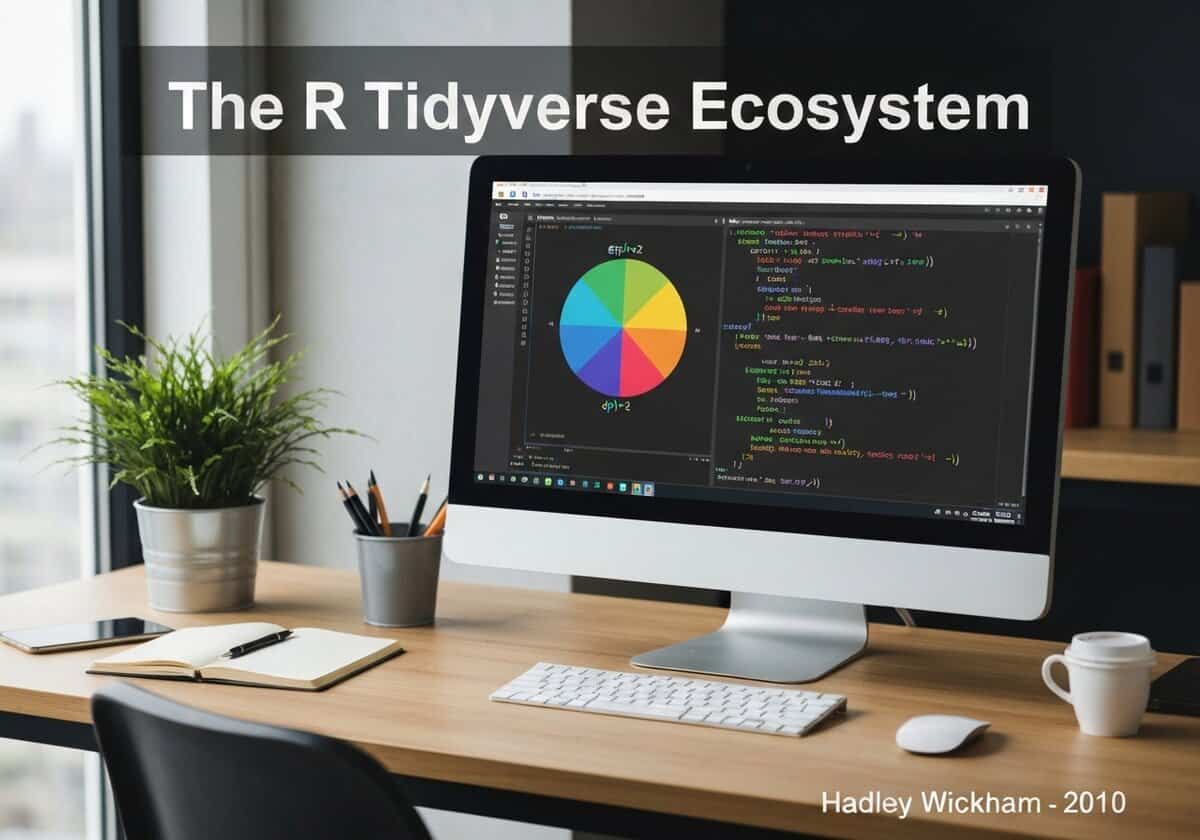
Tidyverse는 데이터 과학을 위해 설계된 R 패키지 모음으로, 공통된 설계 철학, 문법 및 데이터 구조를 공유합니다. Hadley Wickham을 비롯한 개발자들이 만든 Tidyverse는 데이터 가져오기, 정리, 변환, 시각화 및 모델링을 위한 일관되고 강력한 도구를 제공합니다. 주요 패키지로는 `ggplot2`, `dplyr`, `tidyr`, `readr` 등이 있으며, 이들은 파이프 연산자를 사용하여 함께 사용할 수 있습니다.


(설명을 위한 생성된 이미지입니다)
Tidyverse는 데이터 과학을 위해 설계된 R 패키지 모음으로, 공통된 설계 철학, 문법 및 데이터 구조를 공유합니다. Hadley Wickham을 비롯한 개발자들이 만든 Tidyverse는 데이터 가져오기, 정리, 변환, 시각화 및 모델링을 위한 일관되고 강력한 도구를 제공합니다. 주요 패키지로는 `ggplot2`, `dplyr`, `tidyr`, `readr` 등이 있으며, 이들은 파이프 연산자를 사용하여 함께 사용할 수 있습니다.

The Tidyverse is an opinionated ecosystem of R packages that has profoundly influenced modern data analysis in R. It is built on the concept of “tidy data,” a standard way of organizing data where each variable is a column, each observation is a row, and each type of observational unit is a table. This consistent data structure allows for the creation of tools that compose together elegantly.
The core philosophy of the Tidyverse is to make data analysis more human-readable and intuitive. This is achieved through consistent function and argument names and the extensive use of the pipe operator (`%>%` or `|>`), which allows for chaining operations together in a sequence that reads like a sentence (e.g., `data %>% filter(…) %>% group_by(…) %>% summarize(…)`). Key packages provide specialized tools: `dplyr` for data manipulation, `ggplot2` for declarative data visualization based on the “Grammar of Graphics,” `tidyr` for tidying data, `readr` for fast data import, and `purrr` for functional programming. While sometimes criticized for being a separate “dialect” of R, the Tidyverse has become a de facto standard for many data scientists due to its efficiency and expressive power.
R Tidyverse 생태계
(날짜를 알 수 없거나 관련이 없는 경우, 예를 들어 "유체역학"의 경우, 주목할 만한 등장 시기를 대략적으로 추정하여 제공합니다.)

고화질 이미지 및 다운로드는 등록된 회원에게만 100% 무료로 제공됩니다.
> 로그인 <